library("spiDE")

library(ggplot2)
ggplot(mtcars, aes(wt, mpg)) + geom_point() + theme_spiDE()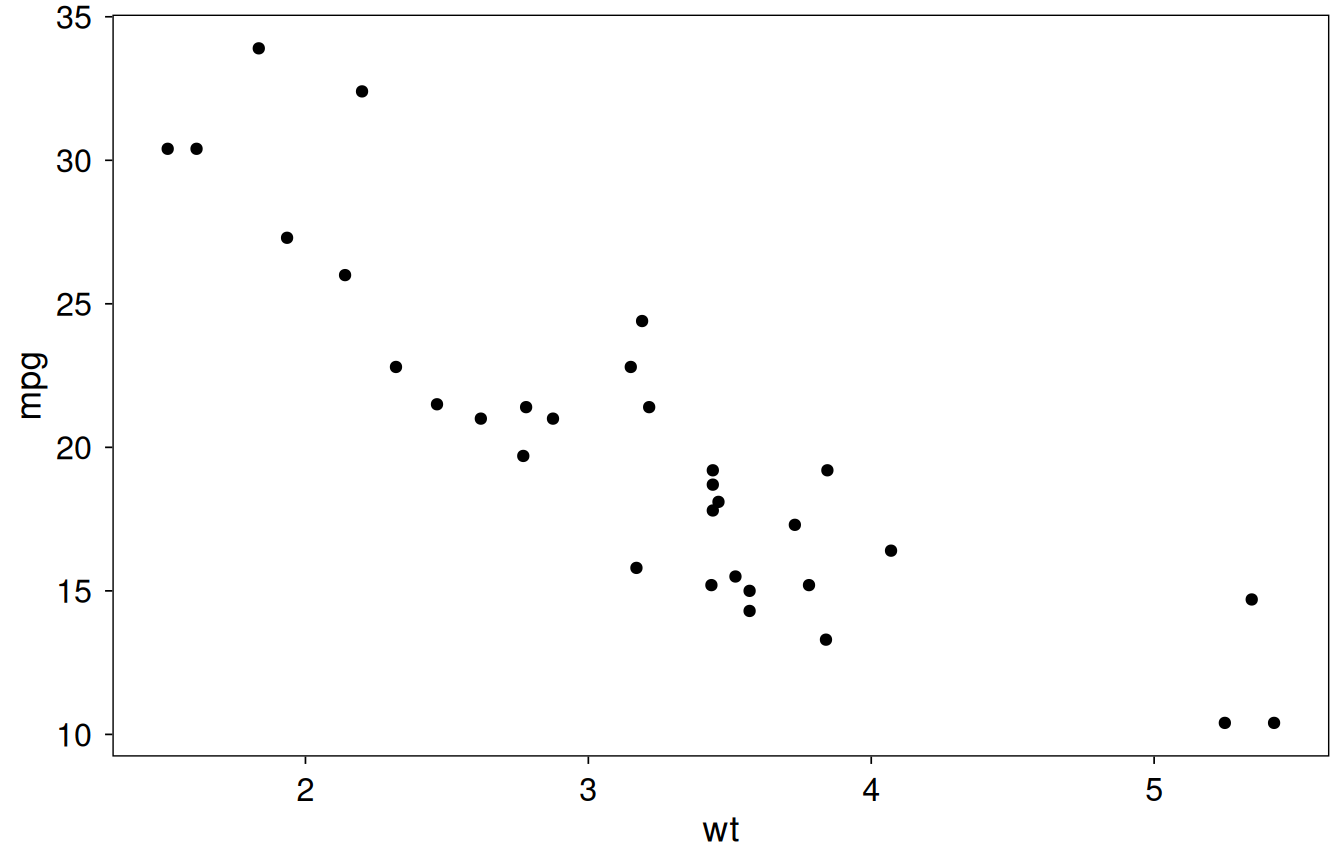
The theme of every spiDE plot: a black panel border, no grid lines, black axis ticks, boxed facet strips and italic legend titles, with text scaled by rl. Add it to your own ggplots so that they match spiDE’s, and change any element with a further + theme(…).
theme_spiDE(rl = 1.1)
rl
|
a positive number, the text size relative to ggplot2’s default. |
a ggplot2 theme.
spiDEColours()
library("spiDE")
library(ggplot2)
ggplot(mtcars, aes(wt, mpg)) + geom_point() + theme_spiDE()