library("spiDE")
data(toySpiDE)
spe <- buildNiches(toySpiDE, sigma = 30)
res <- spiDE(spe, condition = "condition", sigma = 30, verbose = FALSE)
plotTopTriplets(res, test = "pooled", n = 15, spe = spe)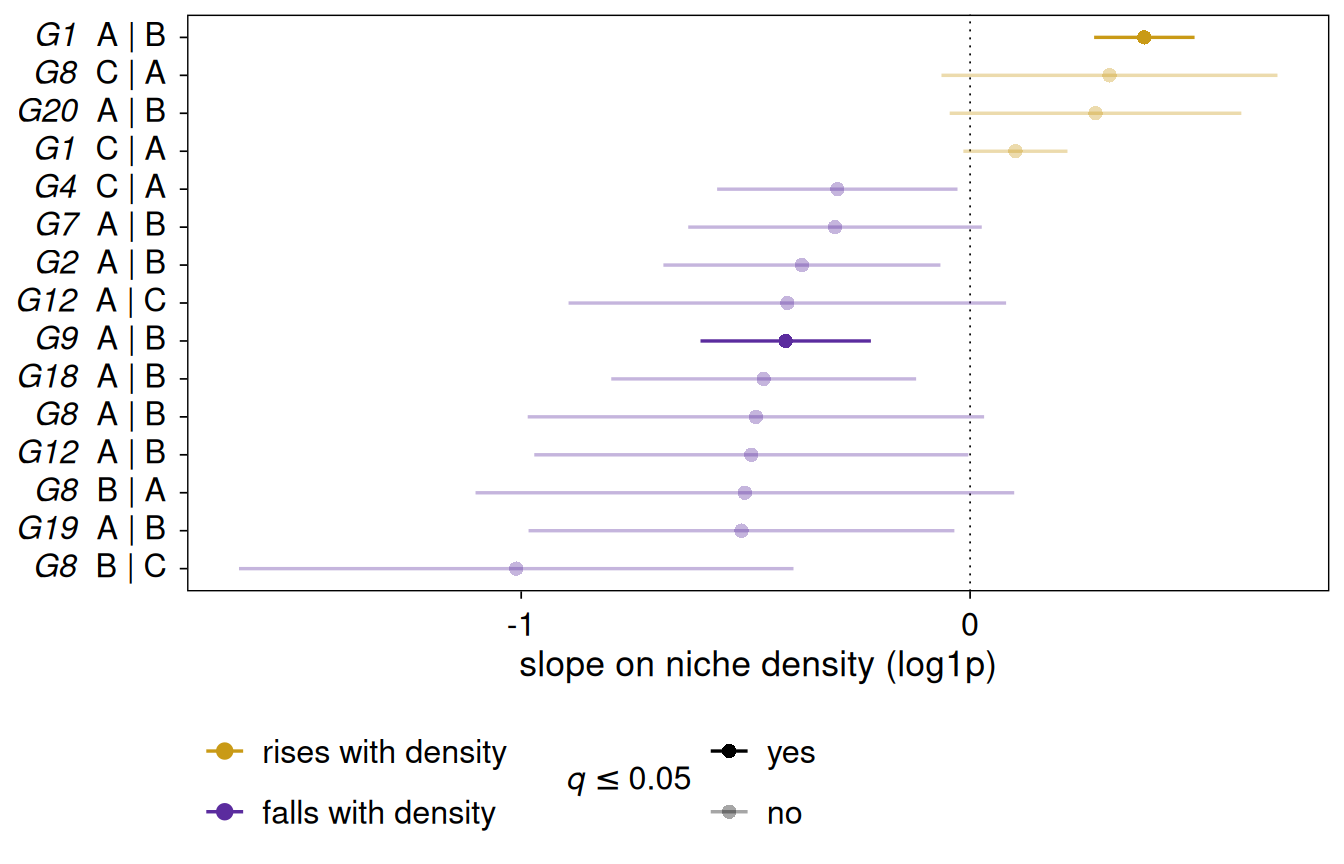
plotTopTriplets(res, gene = "G1")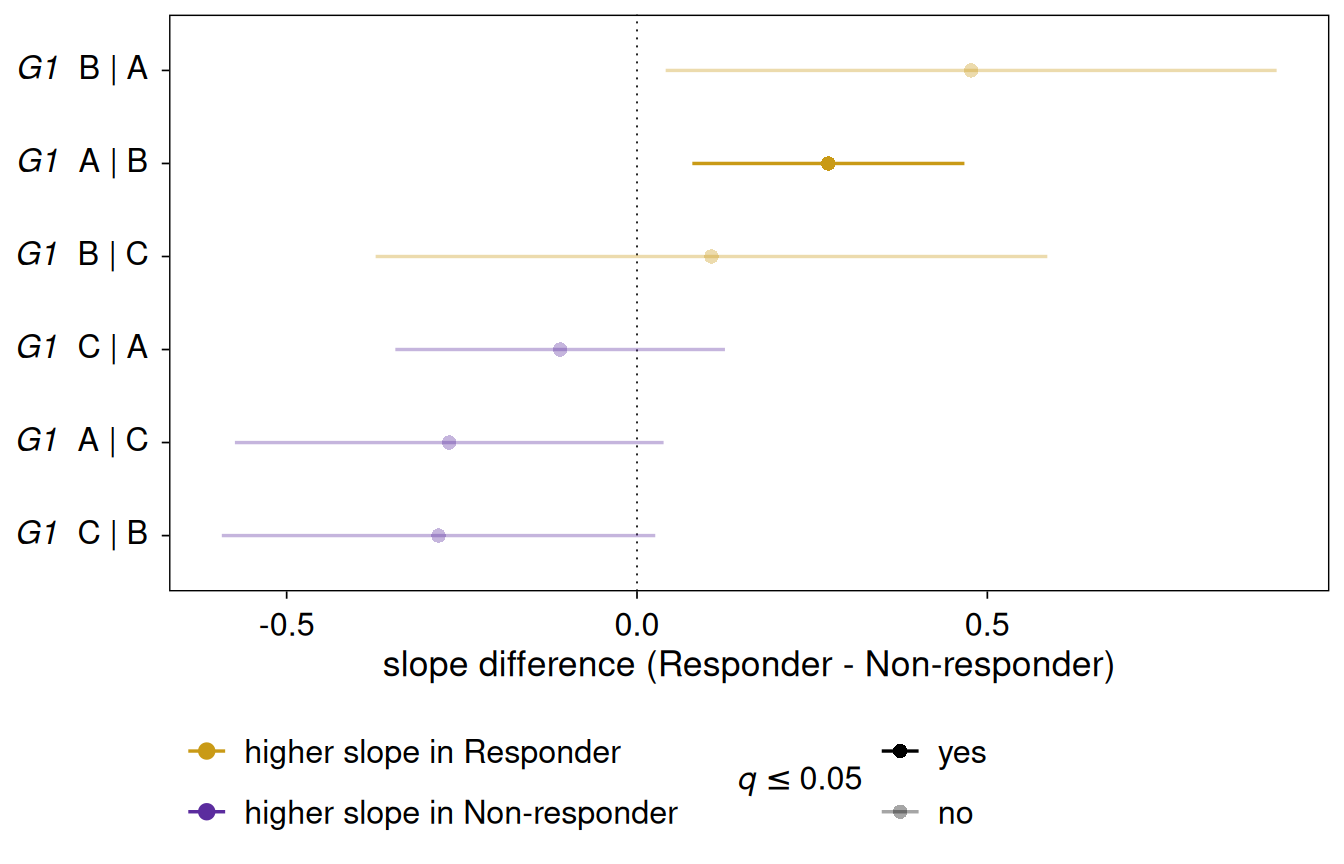
A forest plot: each triplet’s estimate (the pooled slope, or the slope difference between conditions) with its 95
where it is not called. gene, index and niche filter the table before the n smallest p-values are taken, so gene = c(“CD74”, “HLA-DRA”) shows those genes’ triplets. With spe, a hollow triangle marks a gene at least fold-fold higher in the niche type than in the index type (see plotSpillover()).
plotTopTriplets(
  x,
  test = NULL,
  n = 30L,
  gene = NULL,
  index = NULL,
  niche = NULL,
  spe = NULL,
  fold = 4,
  fdr = x@fdr,
  assay = "counts",
  name = "Niche"
)
x
|
a SpiDEResults. |
test
|
NULL (the condition-specific test if run, else the pooled test), “pooled” or “condition”.
|
n
|
the number of triplets. |
gene, index, niche
|
optional filters. |
spe
|
NULL or the SpatialExperiment, for the niche-marker flag.
|
fold
|
the niche-marker threshold. |
fdr
|
the q-value threshold of a call. |
assay, name
|
the counts assay and the niche reducedDim prefix. |
a ggplot; p$data is the plotted rows of the results table with lo, hi, called, direction, marker and label (plotmath).
library("spiDE")

data(toySpiDE)
spe <- buildNiches(toySpiDE, sigma = 30)
res <- spiDE(spe, condition = "condition", sigma = 30, verbose = FALSE)
plotTopTriplets(res, test = "pooled", n = 15, spe = spe)
plotTopTriplets(res, gene = "G1")