library("spiDE")
data(toySpiDE)
spe <- buildNiches(toySpiDE, sigma = 30)
res <- spiDE(spe, condition = "condition", sigma = 30, verbose = FALSE)
plotSpillover(res, spe)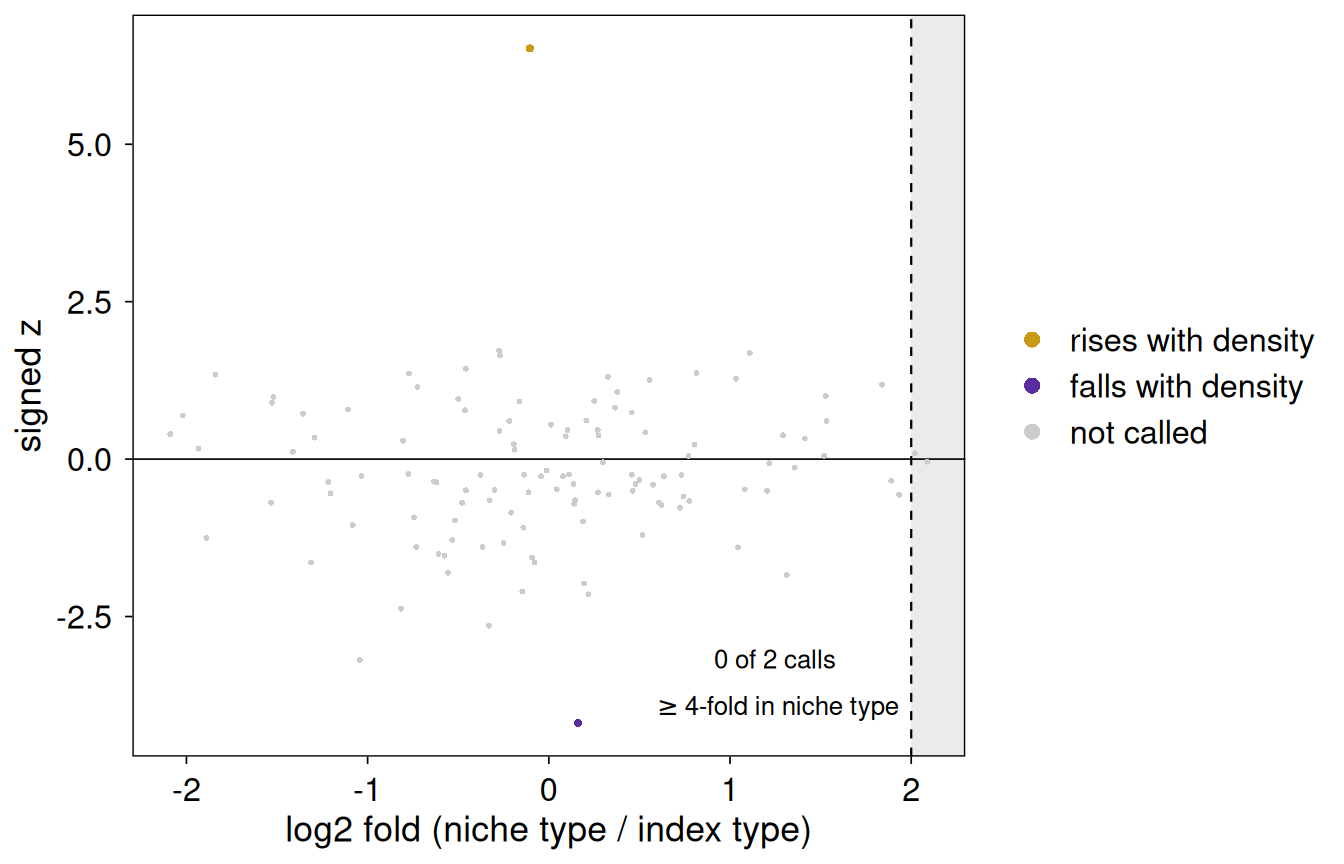
Every tested triplet, placed by how much higher the gene is in the niche type than in the index type (log2, from each cell type’s mean counts per 10,000) against the signed z of its test; calls are coloured by direction. A gene several-fold higher in the niche type whose measured level in the index cells rises with that niche’s density is what transcripts leaking across segmentation boundaries would produce: the association is real in the data, but it needs orthogonal evidence (nuclear counts, a spillover-corrected segmentation) before it is read as biology.
plotSpillover(
  x,
  spe,
  test = "pooled",
  fold = 4,
  label = 6L,
  fdr = x@fdr,
  assay = "counts",
  name = "Niche"
)
x
|
a SpiDEResults. |
spe
|
the SpatialExperiment the results came from. |
test
|
“pooled” or “condition”.
|
fold
|
the niche-marker threshold (shaded). |
label
|
the number of markers labelled (strongest first). |
fdr
|
the q-value threshold of a call. |
assay, name
|
the counts assay and the niche reducedDim prefix. |
a ggplot; p$data is the test’s rows of the results table with fold (log2), z and status.
library("spiDE")

data(toySpiDE)
spe <- buildNiches(toySpiDE, sigma = 30)
res <- spiDE(spe, condition = "condition", sigma = 30, verbose = FALSE)
plotSpillover(res, spe)