library("spiDE")
data(toySpiDE)
res <- spiDE(toySpiDE, condition = "condition", sigma = 30, index = "A", verbose = FALSE)
plotPatientEffects(res, index = "A")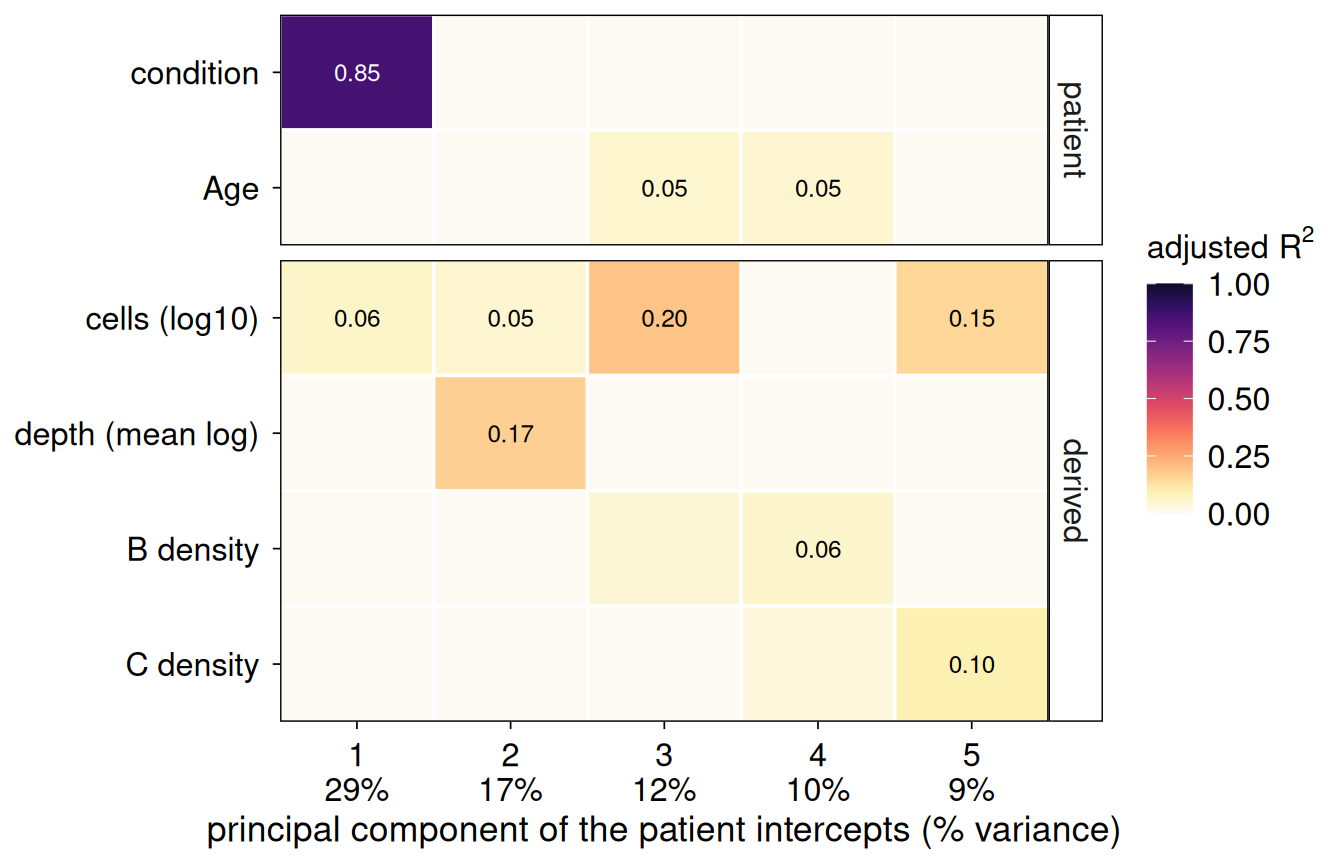
plotPatientEffects(res, index = "A", niche = "B")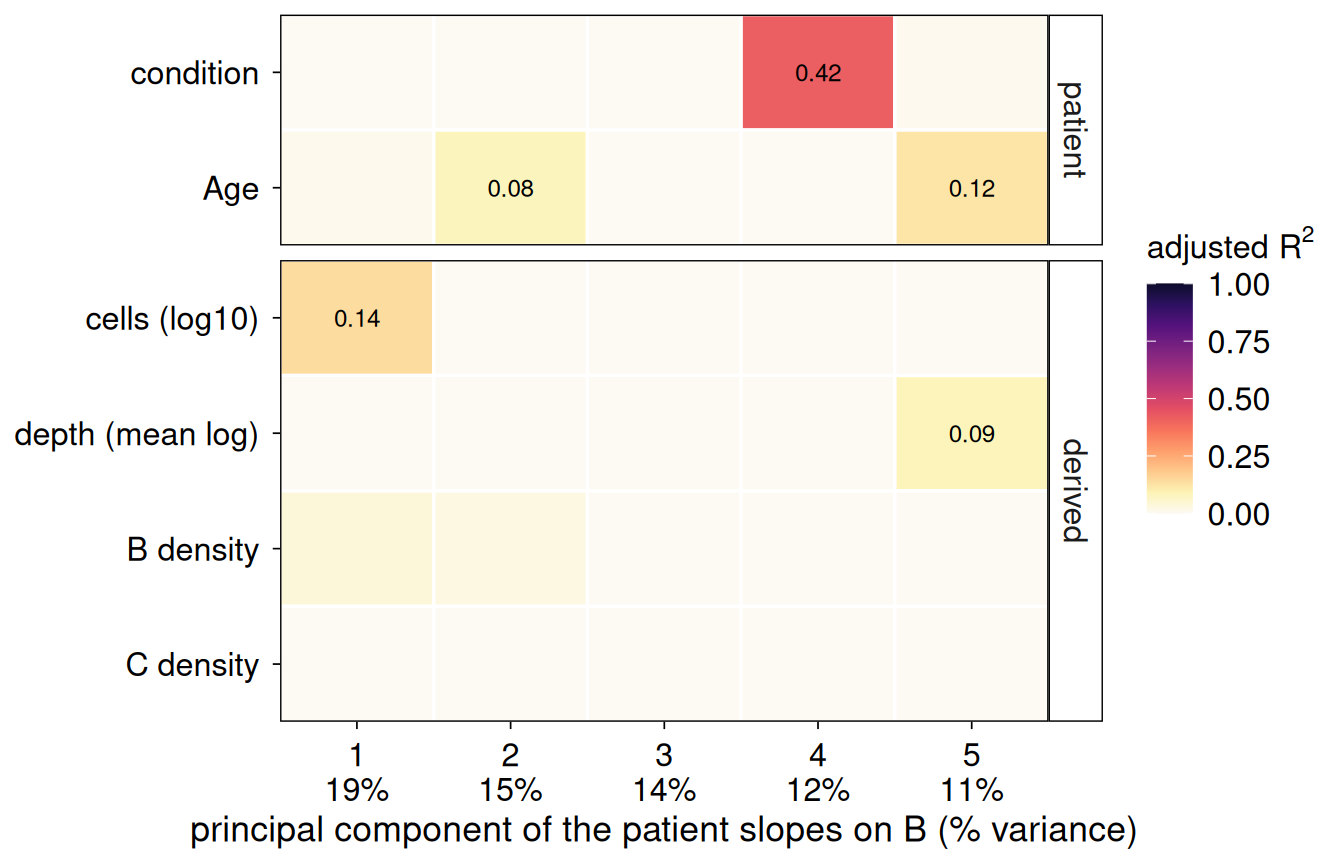
Every index type’s shared fit gives each patient an intercept per gene (see patientIntercepts()): they absorb every difference between patients – the condition’s main effect, composition, batch – which is what makes the niche slopes within-patient slopes. This relates the principal components of the patients’ gene-centred intercepts to patient covariates: every patient-level colData column, plus the patients’ index cells (log10), mean log library size, and mean log1p density of each tested niche type. Each tile is the adjusted \(R^2\) of a component on a covariate.
plotPatientEffects(
  x,
  index,
  niche = NULL,
  covariates = NULL,
  type = c("association", "pca"),
  colour.by = NULL,
  n.pcs = 5L,
  ntop = 500L
)
x
|
a SpiDEResults or SpiDEFit (spiDE >= 0.99.34). |
index
|
the index cell type. |
niche
|
NULL (the intercepts) or a niche type (its slopes; slopes engine).
|
covariates
|
NULL (all) or the covariates to show, by the names in the plot.
|
type
|
“association” (the \(R^2\) tiles) or “pca” (the first two components, coloured by colour.by).
|
colour.by
|
for type = “pca”: a covariate (default the condition, else the first).
|
n.pcs
|
the number of components shown. |
ntop
|
the number of genes, most expressed first, whose intercepts enter the components (a gene with any non-finite value is left out). |
Structure in the intercepts is harmless to the tests: it is absorbed by design. With niche, the same analysis runs on the patients’ slopes on that niche (each gene’s slopes scaled by its between-patient spread, as in spiGSEA()): a slide or batch that organises the slopes can reach the condition test, and belongs in strata.
a ggplot. For “association”, p$data has pc, covariate, r2 and group (patient or derived); for “pca”, patient, PC1, PC2 and the covariate.
patientIntercepts(), testNicheAbundance() for the composition association gene by gene.
library("spiDE")

data(toySpiDE)
res <- spiDE(toySpiDE, condition = "condition", sigma = 30, index = "A", verbose = FALSE)
plotPatientEffects(res, index = "A")
plotPatientEffects(res, index = "A", niche = "B")