library("spiDE")

data(toySpiDE)
res <- spiDE(toySpiDE, condition = "condition", sigma = 30, procedure = "all", verbose = FALSE)
plotPValues(res)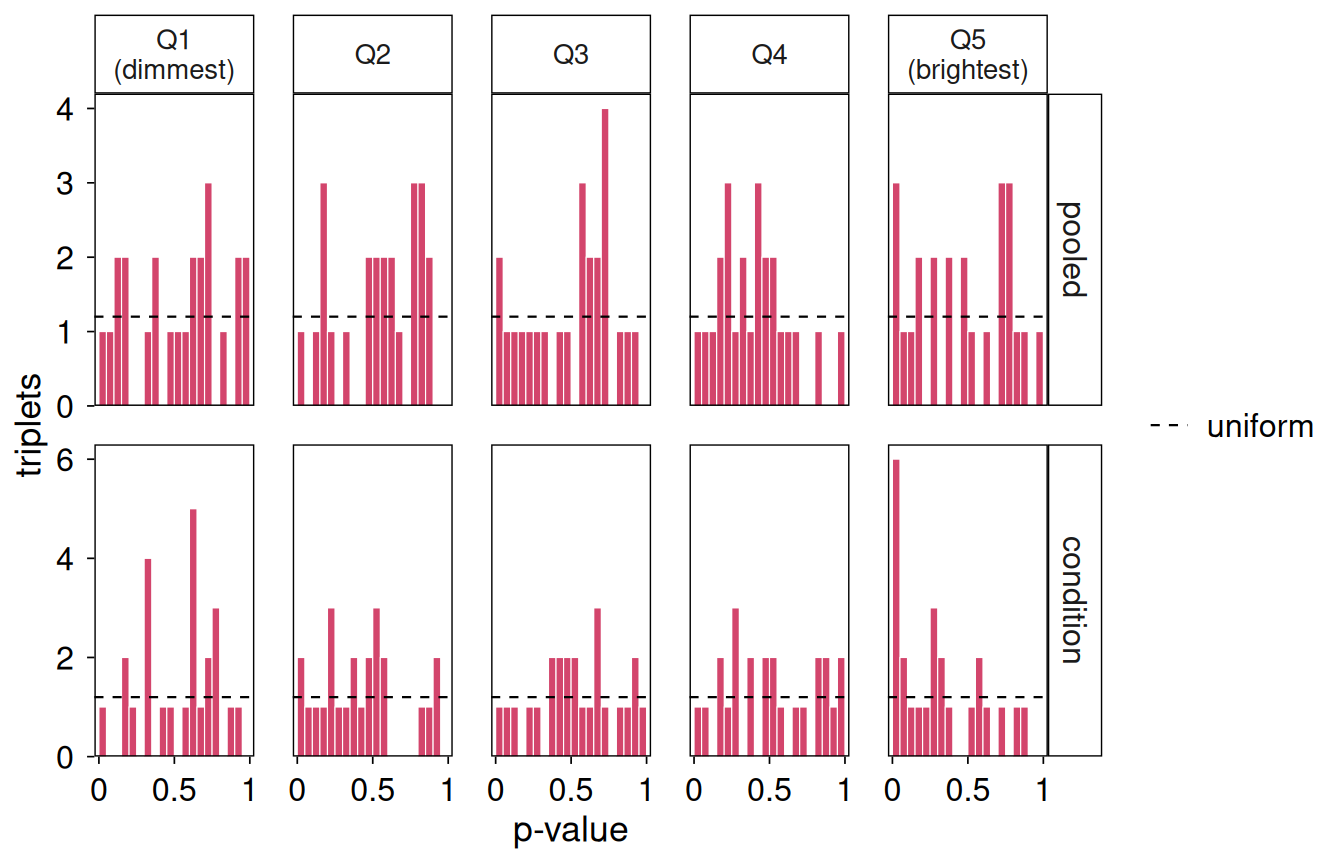
Histograms of every triplet’s p-value, one row per test and one column per fifth of each index type’s genes by mean expression, with the level of a uniform distribution dashed. A spike at 0 on a flat floor is signal. A floor that rises toward 0 only in the brightest genes, or a hump at 1 (low power, conservative p-values), deserves a look at the calibration vignette. This is a sanity check, not a calibration test: real signal also moves p-values toward 0, and calibration needs data where there is nothing to find.
plotPValues(x, bands = 5L)
x
|
a SpiDEResults. |
bands
|
the number of expression bands. |
a ggplot; p$data has one row per tested triplet with p, test and band.
library("spiDE")
data(toySpiDE)
res <- spiDE(toySpiDE, condition = "condition", sigma = 30, procedure = "all", verbose = FALSE)
plotPValues(res)