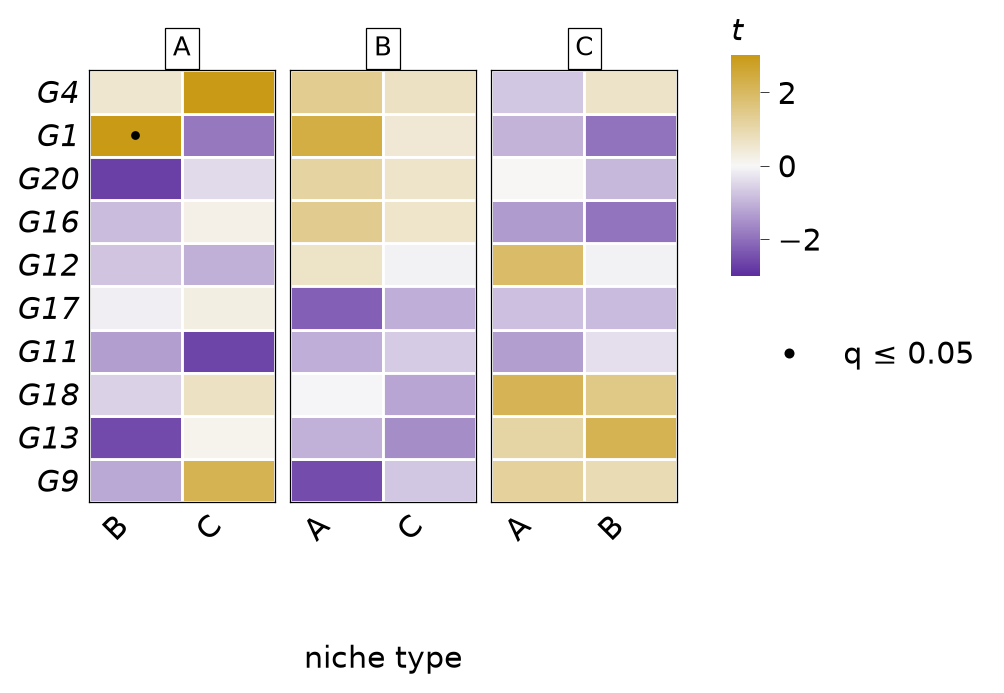
Niche-response profiles of genes or gene sets (R plotTripletHeatmap).
Features (genes, or gene sets from spi_gsea) against every (index, niche) column: the fill is the test’s t (gold: the slope rises with the niche’s density, or is higher in the second condition; violet: the reverse), a dot marks a call, grey a feature not tested in that index type. Rows are clustered on their t profiles. Read it for a gene’s or pathway’s response across all cell-type pairs, and for pairs that share responses.
Parameters
Name
Type
Description
Default
x
SpiDEResults or pandas.DataFrame
Results (genes) or the table spi_gsea returns (sets; calls by q.global).
required
features
sequence of str
None (the n features with the smallest p-value in any column) or the features to show.
None
test
('pooled', 'condition')
Default: the condition-specific test if present, else the pooled test.
"pooled"
n
int
The number of features when features is None.
30
fdr
float
The q-value threshold of a call (default: the results’, or 0.05 for sets).
None
limit
float
The |t| at which the fill saturates (default: the 98th percentile, at least 1).
None
cluster
bool
Order rows by hierarchical clustering of their t profiles.
True
Returns
Name
Type
Description
matplotlib.figure.Figure
One panel per index type.
See Also
spi_gsea : Produces the gene-set table this also draws. plot_top_triplets : The strongest triplets with intervals.