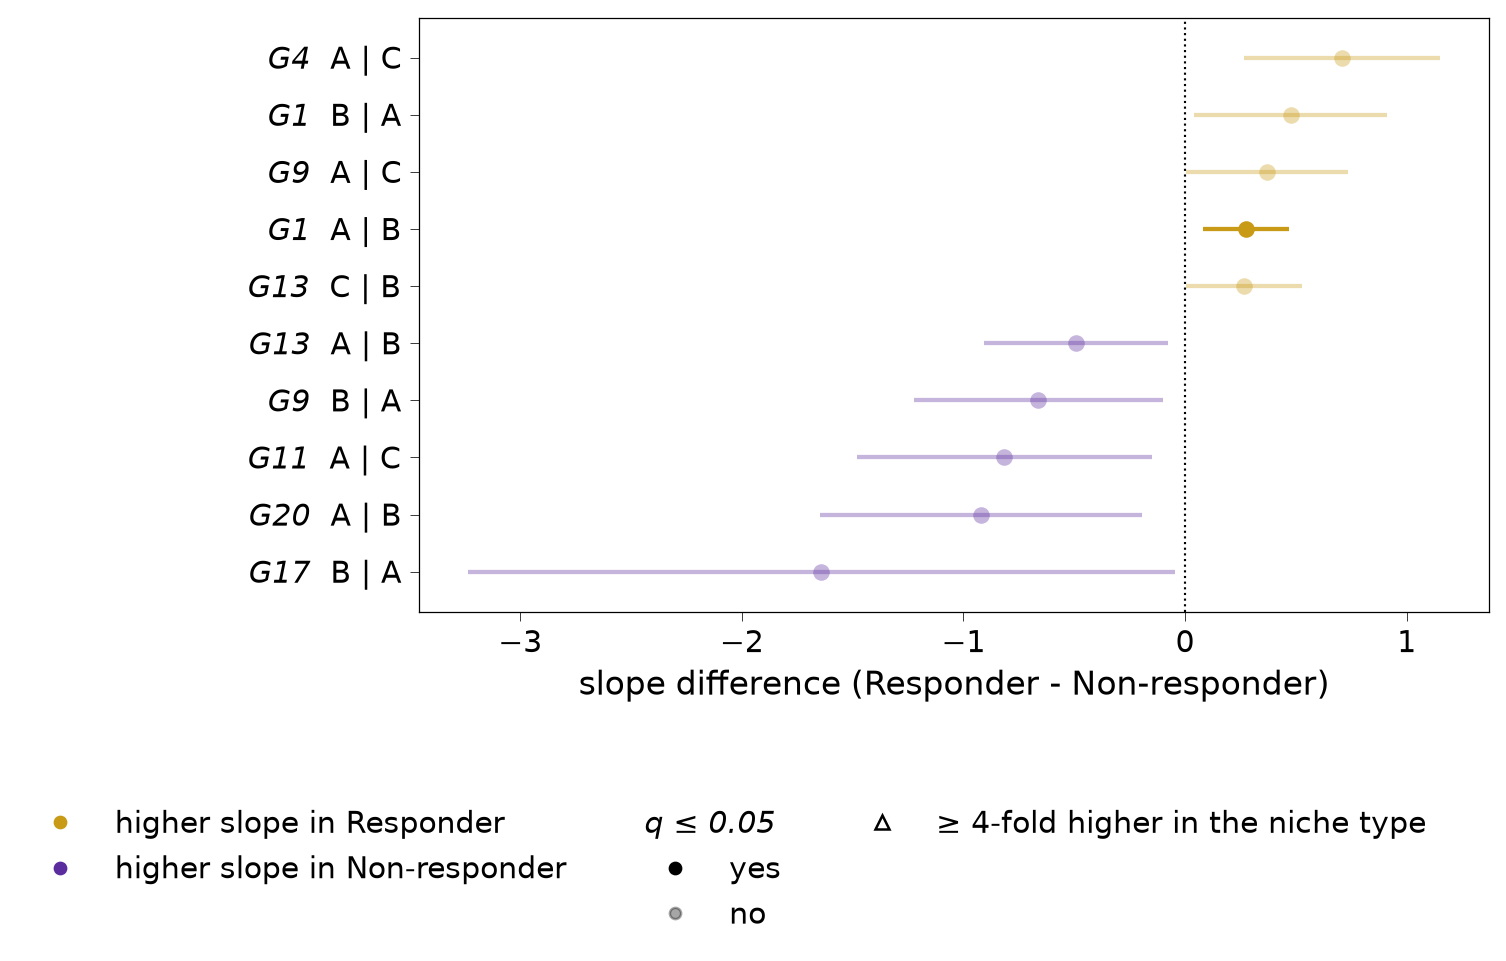
The strongest triplets, or those of chosen genes (R plotTopTriplets).
A forest plot: each triplet’s estimate (the pooled slope, or the slope difference between conditions) with its 95% confidence interval, faded where it is not called. gene, index and niche filter the table before the n smallest p-values are taken, so gene=["CD74", "HLA-DRA"] shows those genes’ triplets. With adata, a hollow triangle marks a gene at least fold-fold higher in the niche type than in the index type (see plot_spillover).
Parameters
Name
Type
Description
Default
res
SpiDEResults
The results to plot.
required
test
('pooled', 'condition')
Default: the condition-specific test if run, else the pooled test.
"pooled"
n
int
The number of triplets.
30
gene
str or sequence of str
Keep only these genes.
None
index
str or sequence of str
Keep only these index cell types.
None
niche
str or sequence of str
Keep only these niche cell types.
None
adata
anndata.AnnData
The object the results came from, for the niche-marker flag.
None
fold
float
The niche-marker threshold, as a fold change.
4
fdr
float
The q-value threshold of a call (default: the results’).
None
assay
str
The counts layer (used with adata).
"counts"
name
str
The niche obsm prefix (used with adata).
"Niche"
Returns
Name
Type
Description
matplotlib.figure.Figure
A forest plot, one row per triplet.
See Also
plot_spillover : The niche-marker check in full. plot_triplet_heatmap : Profiles across every cell-type pair.