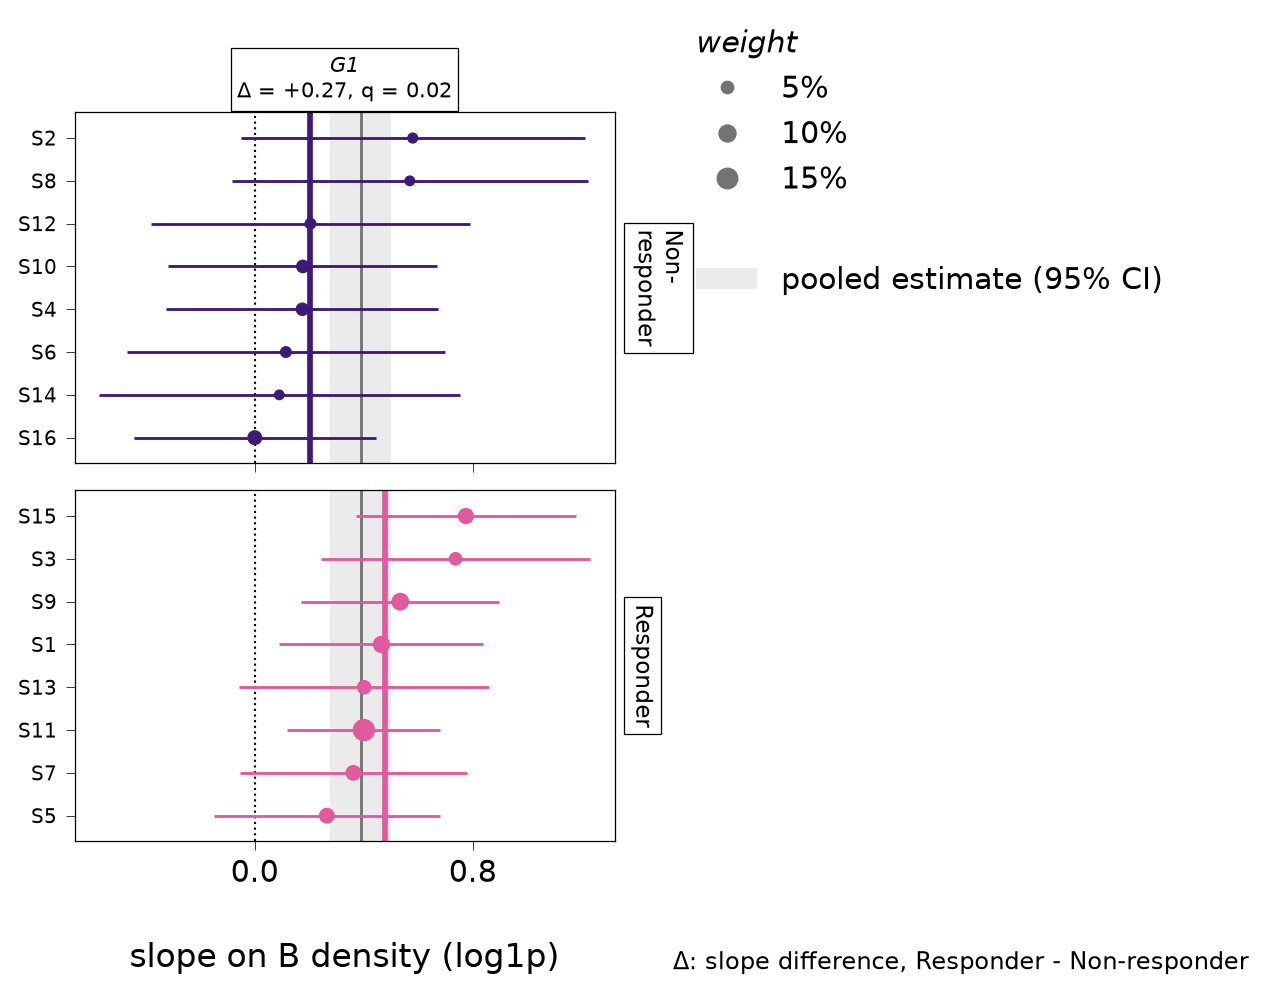
Each patient’s niche slope for a triplet (R plotPatientSlopes).
The evidence the tests weigh: every patient’s own slope of the gene’s expression in the index type on the niche type’s density (log1p), with an interval from its within-patient variance (the variance the tests use) and a point sized by the patient’s weight in them. The pooled estimate and its confidence interval are the grey band. With a condition the patients are split by it, each group’s weighted mean is a coloured line, and each strip gives the condition-specific slope difference and its q-value.
Read it for whether a call rests on patients that agree or on one or two heavily weighted ones, and for why a condition test is missing (each group needs three effective patients). Patients are ordered by group, then by their mean slope over the genes shown, so a row is one patient across genes.
Parameters
Name
Type
Description
Default
res
SpiDEResults
From the slopes engine.
required
gene
str or sequence of str
One or more genes, one column each.
required
index
str
The index cell type.
required
niche
str
The niche cell type.
required
ci
float
The confidence level of the intervals.
0.95
Returns
Name
Type
Description
matplotlib.figure.Figure
One column per gene and one row per condition group.
See Also
patient_slopes : The slopes drawn here, as a table. plot_niche_response : The cells behind a slope.