pl.plot_p_values

pl.plot_p_values(res, bands=5)

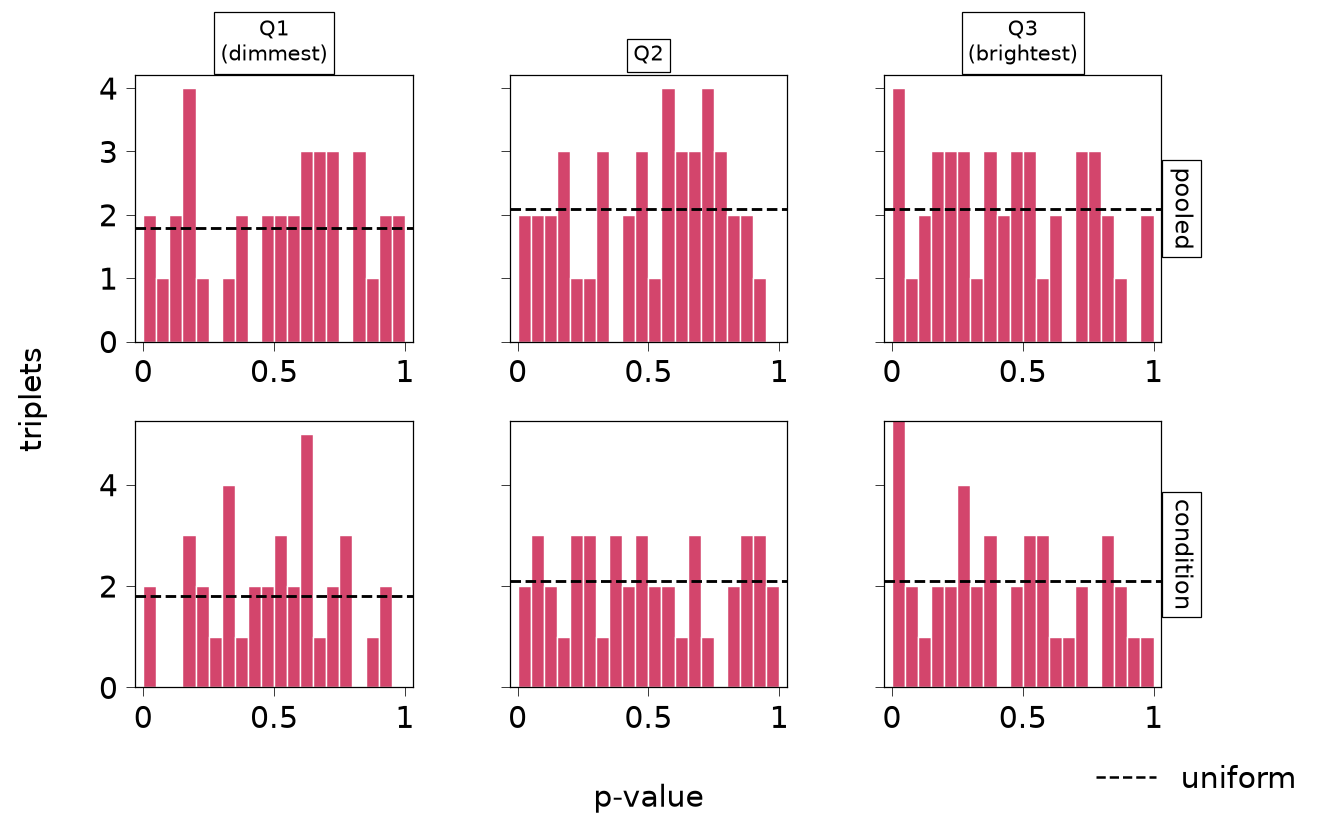
p-values by test and expression band (R plotPValues).

Histograms of every triplet’s p-value, one row per test and one column per fifth of each index type’s genes by mean expression, with the level of a uniform distribution dashed. A spike at 0 on a flat floor is signal. A floor that rises toward 0 only in the brightest genes, or a hump at 1 (low power, conservative p-values), deserves a look at the calibration vignette. This is a sanity check, not a calibration test: real signal also moves p-values toward 0, and calibration needs data where there is nothing to find.
Parameters

Name Type Description Default
res SpiDEResults The results whose p-values are shown. required
bands int The number of expression bands. 5

Returns

Name Type Description
matplotlib.figure.Figure One row per test, one column per expression band.

See Also

plot_top_triplets : The strongest triplets.

Examples

import matplotlib.pyplot as plt
from spidepy import build_niches, fit_spide, test_spide
from spidepy.datasets import toy_spide
from spidepy.pl import plot_p_values
adata = build_niches(toy_spide(), sigma=30)
fit = fit_spide(adata, condition="condition", verbose=False)
res = test_spide(fit)
fig = plot_p_values(res, bands=3)
fig