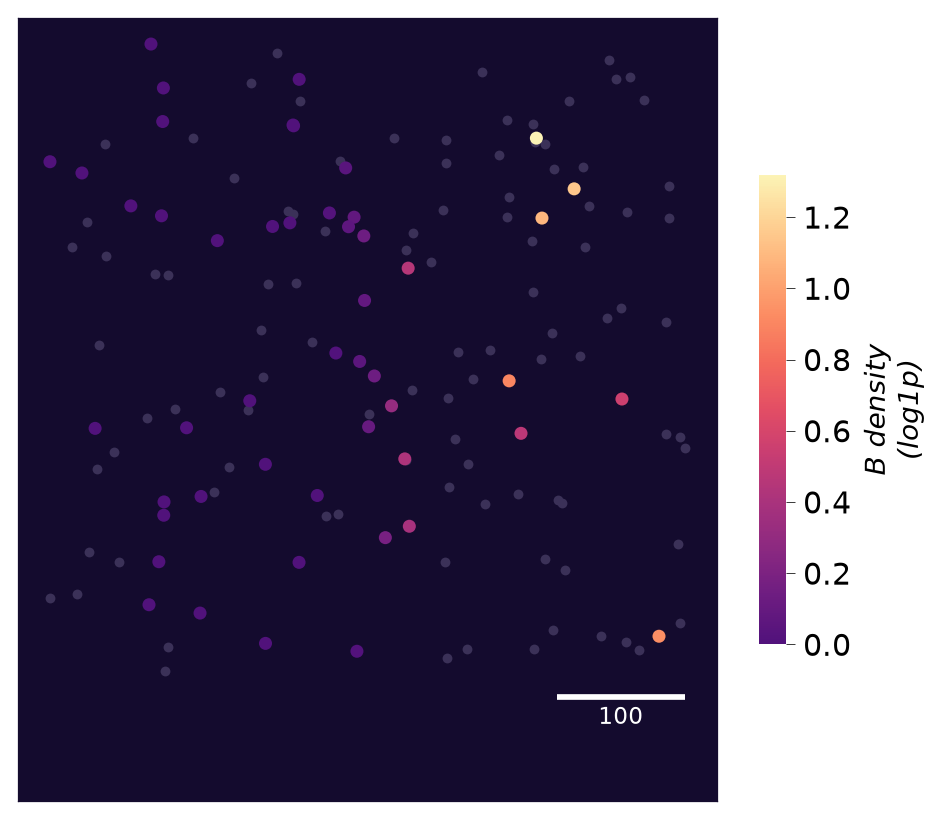
One sample’s cells, coloured by the log1p density of a niche type: the covariate spiDE regresses on. With index, only the index type’s cells are coloured (the covariate as the index type’s model reads it) and the others are dim. The panel is dark (the sticker’s ink) so that the lowest densities stay visible; the colour bar, titles and axes keep the page’s style.
Read it to judge the bandwidth: a speckled field that follows single cells is too small; a field nearly flat within a section is too large (the patient intercept then absorbs it). It also shows where the index cells sit relative to the niche.
Parameters
Name
Type
Description
Default
adata
anndata.AnnData
With niche matrices in obsm (build_niches).
required
niche
str
A niche column (a cell type or a merge_niches group).
required
sample
str
The sample (patient) to show.
required
index
str
An index cell type to highlight.
None
sigma
float
The bandwidth (needed only if adata carries several).
None
cell_type
str
The obs column of the cell type.
"cell_type"
sample_id
str
The obs column of the sample.
"sample_id"
section
str
The obs column of the section; a sample with several sections gets one panel each.
None
name
str
The niche obsm prefix.
"Niche"
point_size
float
The marker diameter in millimetres (1 mm is 2.85 points), which is converted to the area s that matplotlib.axes.Axes.scatter takes; cells outside the index type are drawn at 0.7 of it. Default: from the number of cells, 50 / sqrt(n_cells) limited to 0.05-1.5 mm.
None
scale_bar
bool
Draw a scale bar of about a fifth of the width.
True
unit
str
The coordinates’ unit, for the scale bar’s label (e.g. "um").
None
Returns
Name
Type
Description
matplotlib.figure.Figure
One panel per section, plus the colour bar’s axes.
See Also
build_niches : Builds the niche covariates drawn here. plot_niche_response : Expression against the niche density.