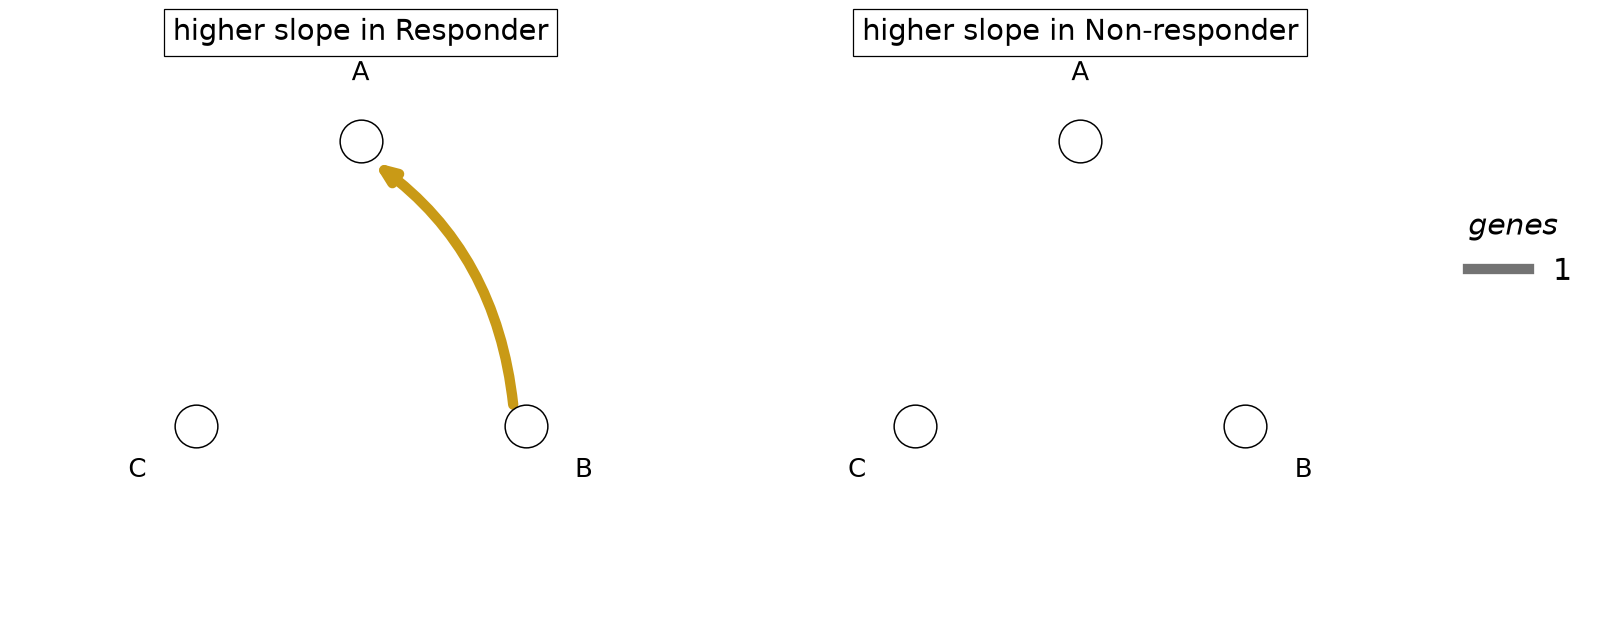
The number of genes called for every (index, niche) pair, split by direction: for the pooled test, a slope that rises or falls with the niche’s density; for the condition-specific test, a slope higher in one condition than in the other. The heatmap gives exact counts and marks untested pairs (an index type against its own niche) in grey; the graph draws cell types on a fixed circle with an arrow from niche to index type, its width the number of genes. It reads best when calls are few (the condition test), the heatmap when every pair has some.
Read it for which cell-type pairs carry the signal, and for pairs whose calls all go one way toward one niche type (the shape segmentation spillover gives; see plot_spillover). An arrow is an association, not signalling.
Parameters
Name
Type
Description
Default
res
SpiDEResults
The results to summarise.
required
test
('pooled', 'condition')
Default: the condition-specific test if run, else the pooled test.
"pooled"
fdr
float
The q-value threshold of a call (default: the results’).
None
style
('heatmap', 'graph')
How the counts are drawn: a grid of index types by niche types ("heatmap"), or cell types on a circle joined by arrows from niche to index type ("graph").
"heatmap"
min_calls
int
The graph’s smallest drawn edge, in genes; pairs with fewer calls get no arrow (style="graph" only).
1
Returns
Name
Type
Description
matplotlib.figure.Figure
Two panels, one per direction.
See Also
plot_spillover : Checks whether the calls are the niche type’s own markers. plot_top_triplets : The strongest individual calls.