plotSpatial

Plot spatial transcriptomic annotations per spot

Description

Plot spatial transcriptomic annotations per spot

Usage

plotSpatial(
  spe,
  what = c("annotation", "expression", "reduceddim"),
  ...,
  assay = SummarizedExperiment::assayNames(spe),
  dimred = SingleCellExperiment::reducedDimNames(spe),
  img = FALSE,
  crop = FALSE,
  imgAlpha = 1,
  rl = 1,
  circles = FALSE
)

Arguments

spe a SpatialExperiment object.
what a character, specifying what aspect should be plot, "annotation", "expression", or reduced dimension ("reduceddim").
… additional aesthetic mappings or fixed parameters (e.g., shape = ".").
assay a character or numeric, specifying the assay to plot (default is the first assay).
dimred a character or numeric, specifying the reduced dimension to plot (default is the first reduced dimension).
img a logical, indicating whether the tissue image (if present) should be plot (default = FALSE).
crop a logical, indicating whether the image should be cropped to the spatial coordinates (default = FALSE).
imgAlpha a numeric, specifying the alpha value for the image (default = 1).
rl a numeric, specifying the relative size of the text (default = 1).
circles a logical, indicating whether the spots should be plotted as circles (default = FALSE). This can be slower for large datasets.

Value

a ggplot2 object

Examples

Note

The code below runs when the site is built, on a small pre-fitted subset of HumanDLPFC (301 genes x 4015 spots; SpaNorm(sample.p = 0.05, df.tps = 2), SpaNormSVG() and SpaNormPCA() already applied) that is fitted once per build. The outputs are those of the code shown.

library("SpaNorm")

library(SpatialExperiment)
library(ggplot2)

# load data
data(HumanDLPFC)

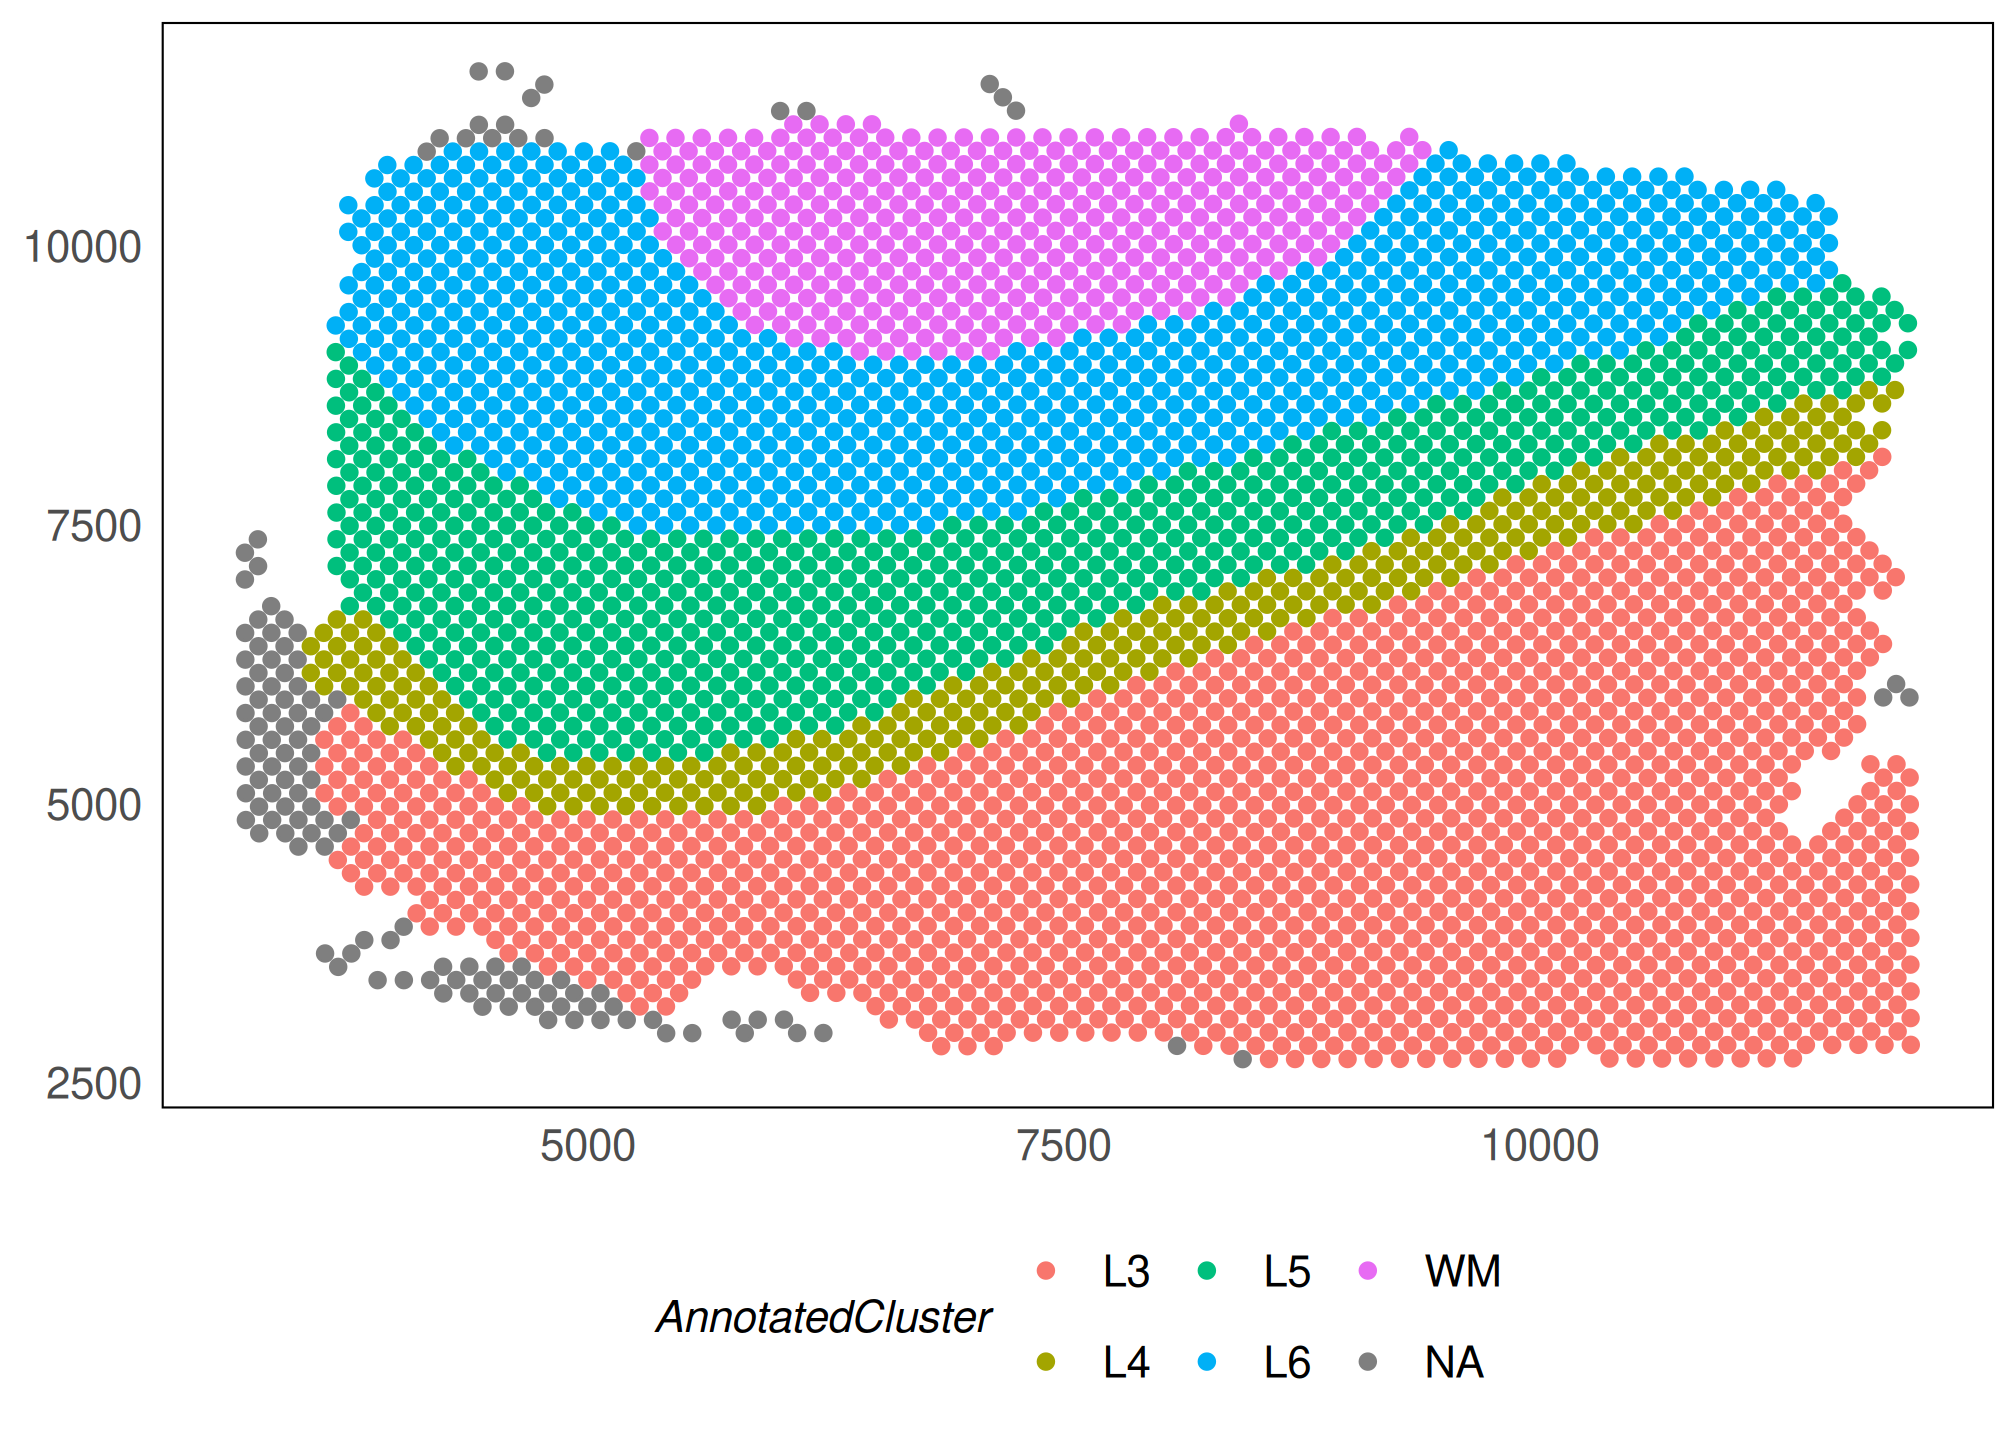
# plot spatial region annotations
p1 <- plotSpatial(HumanDLPFC, colour = AnnotatedCluster)
p1
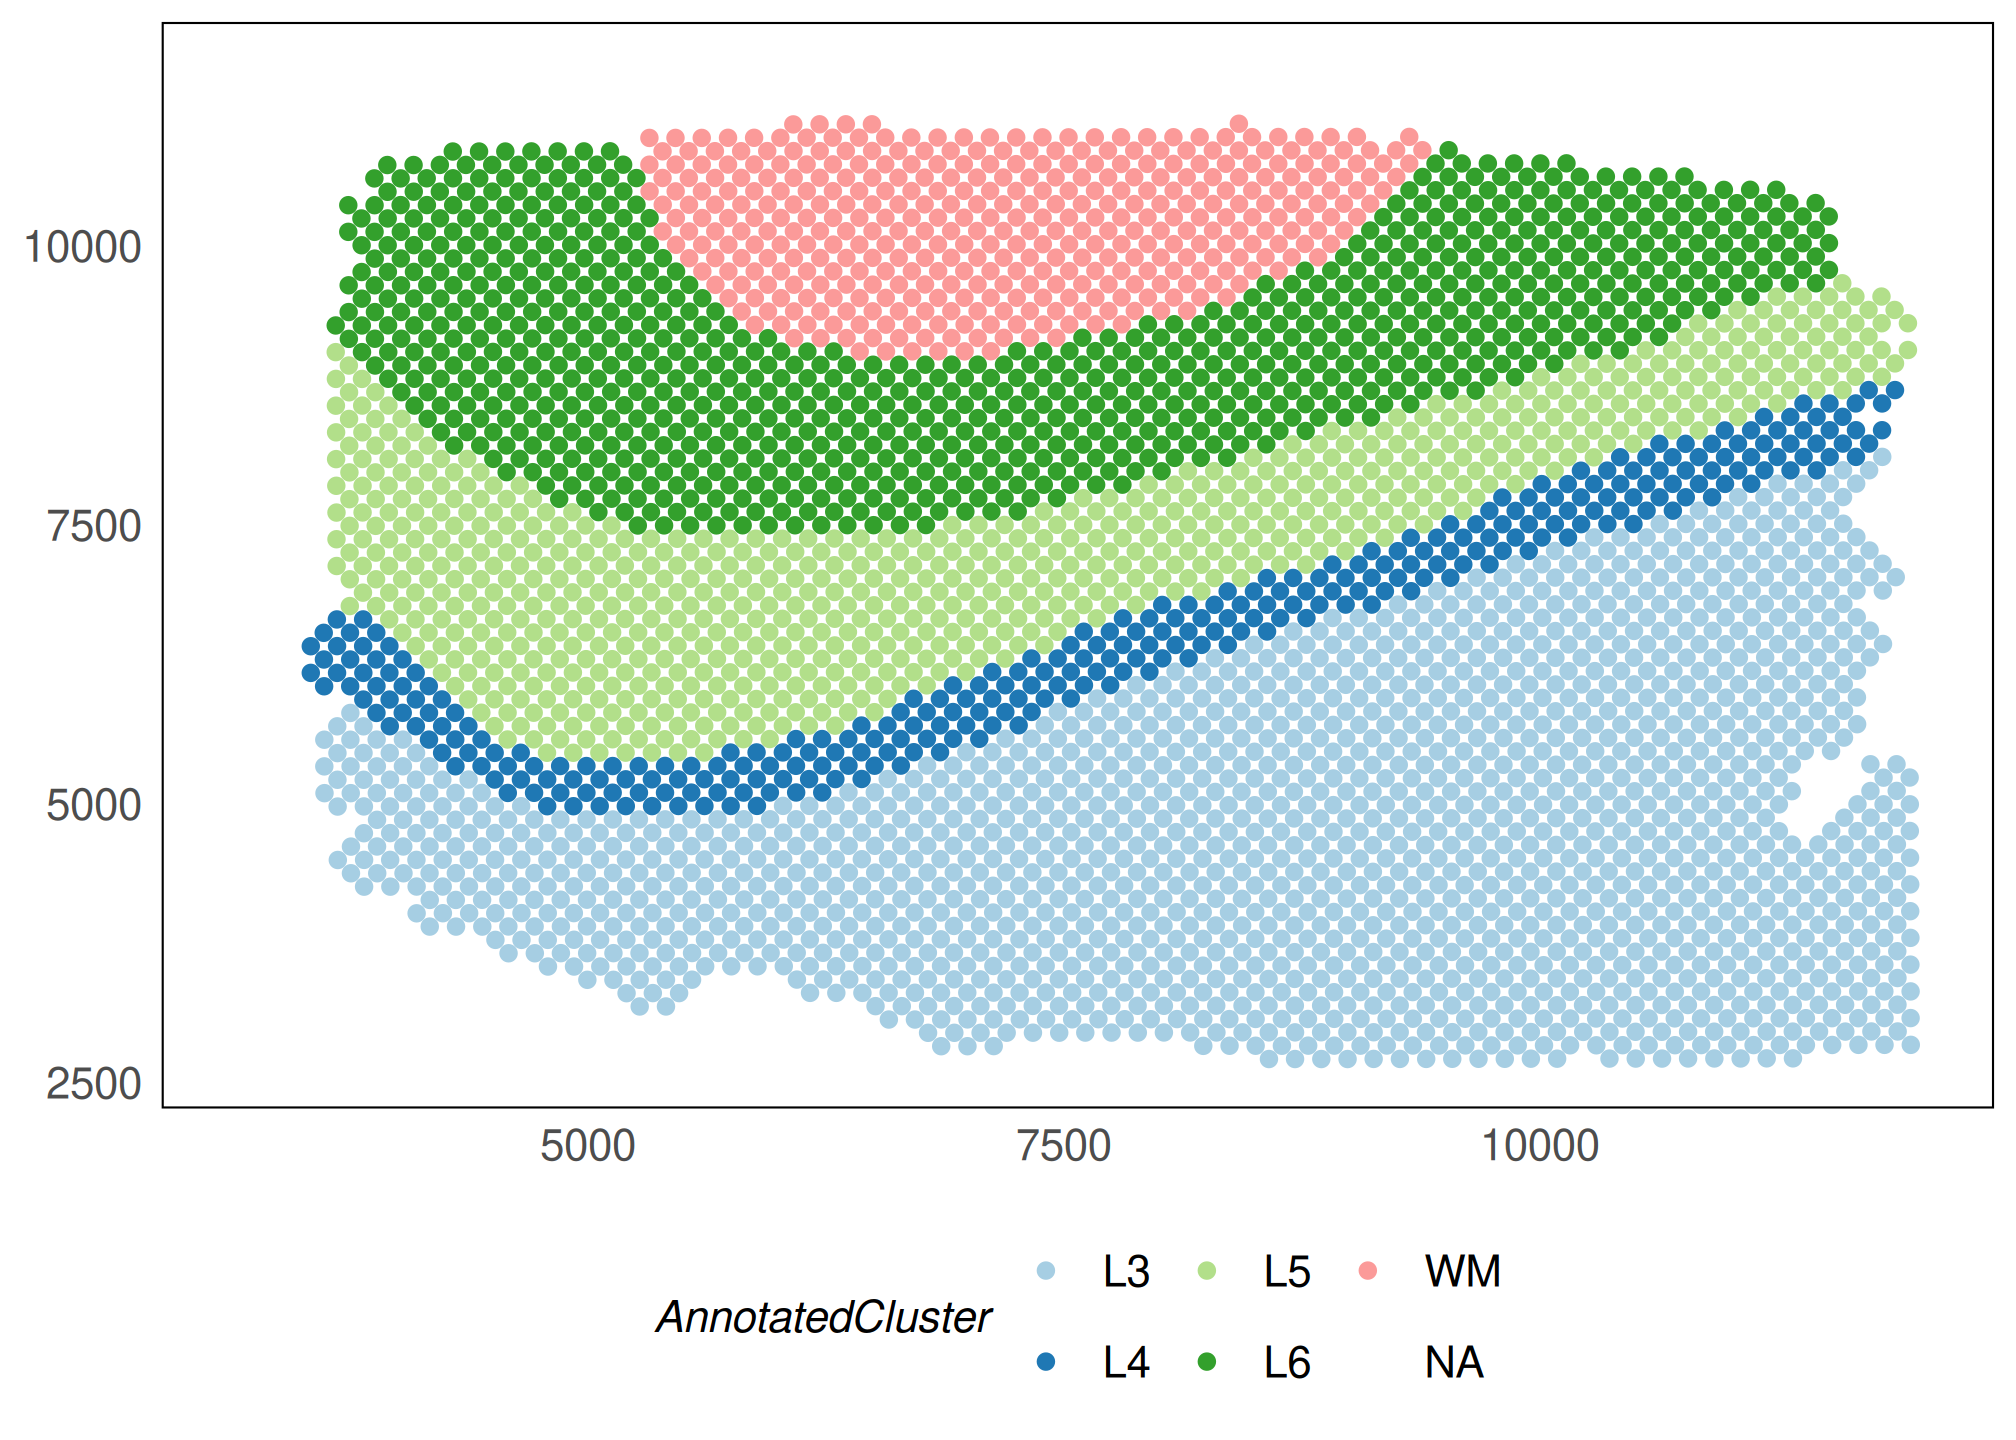
# change colour scale
p1 + scale_colour_brewer(palette = "Paired")
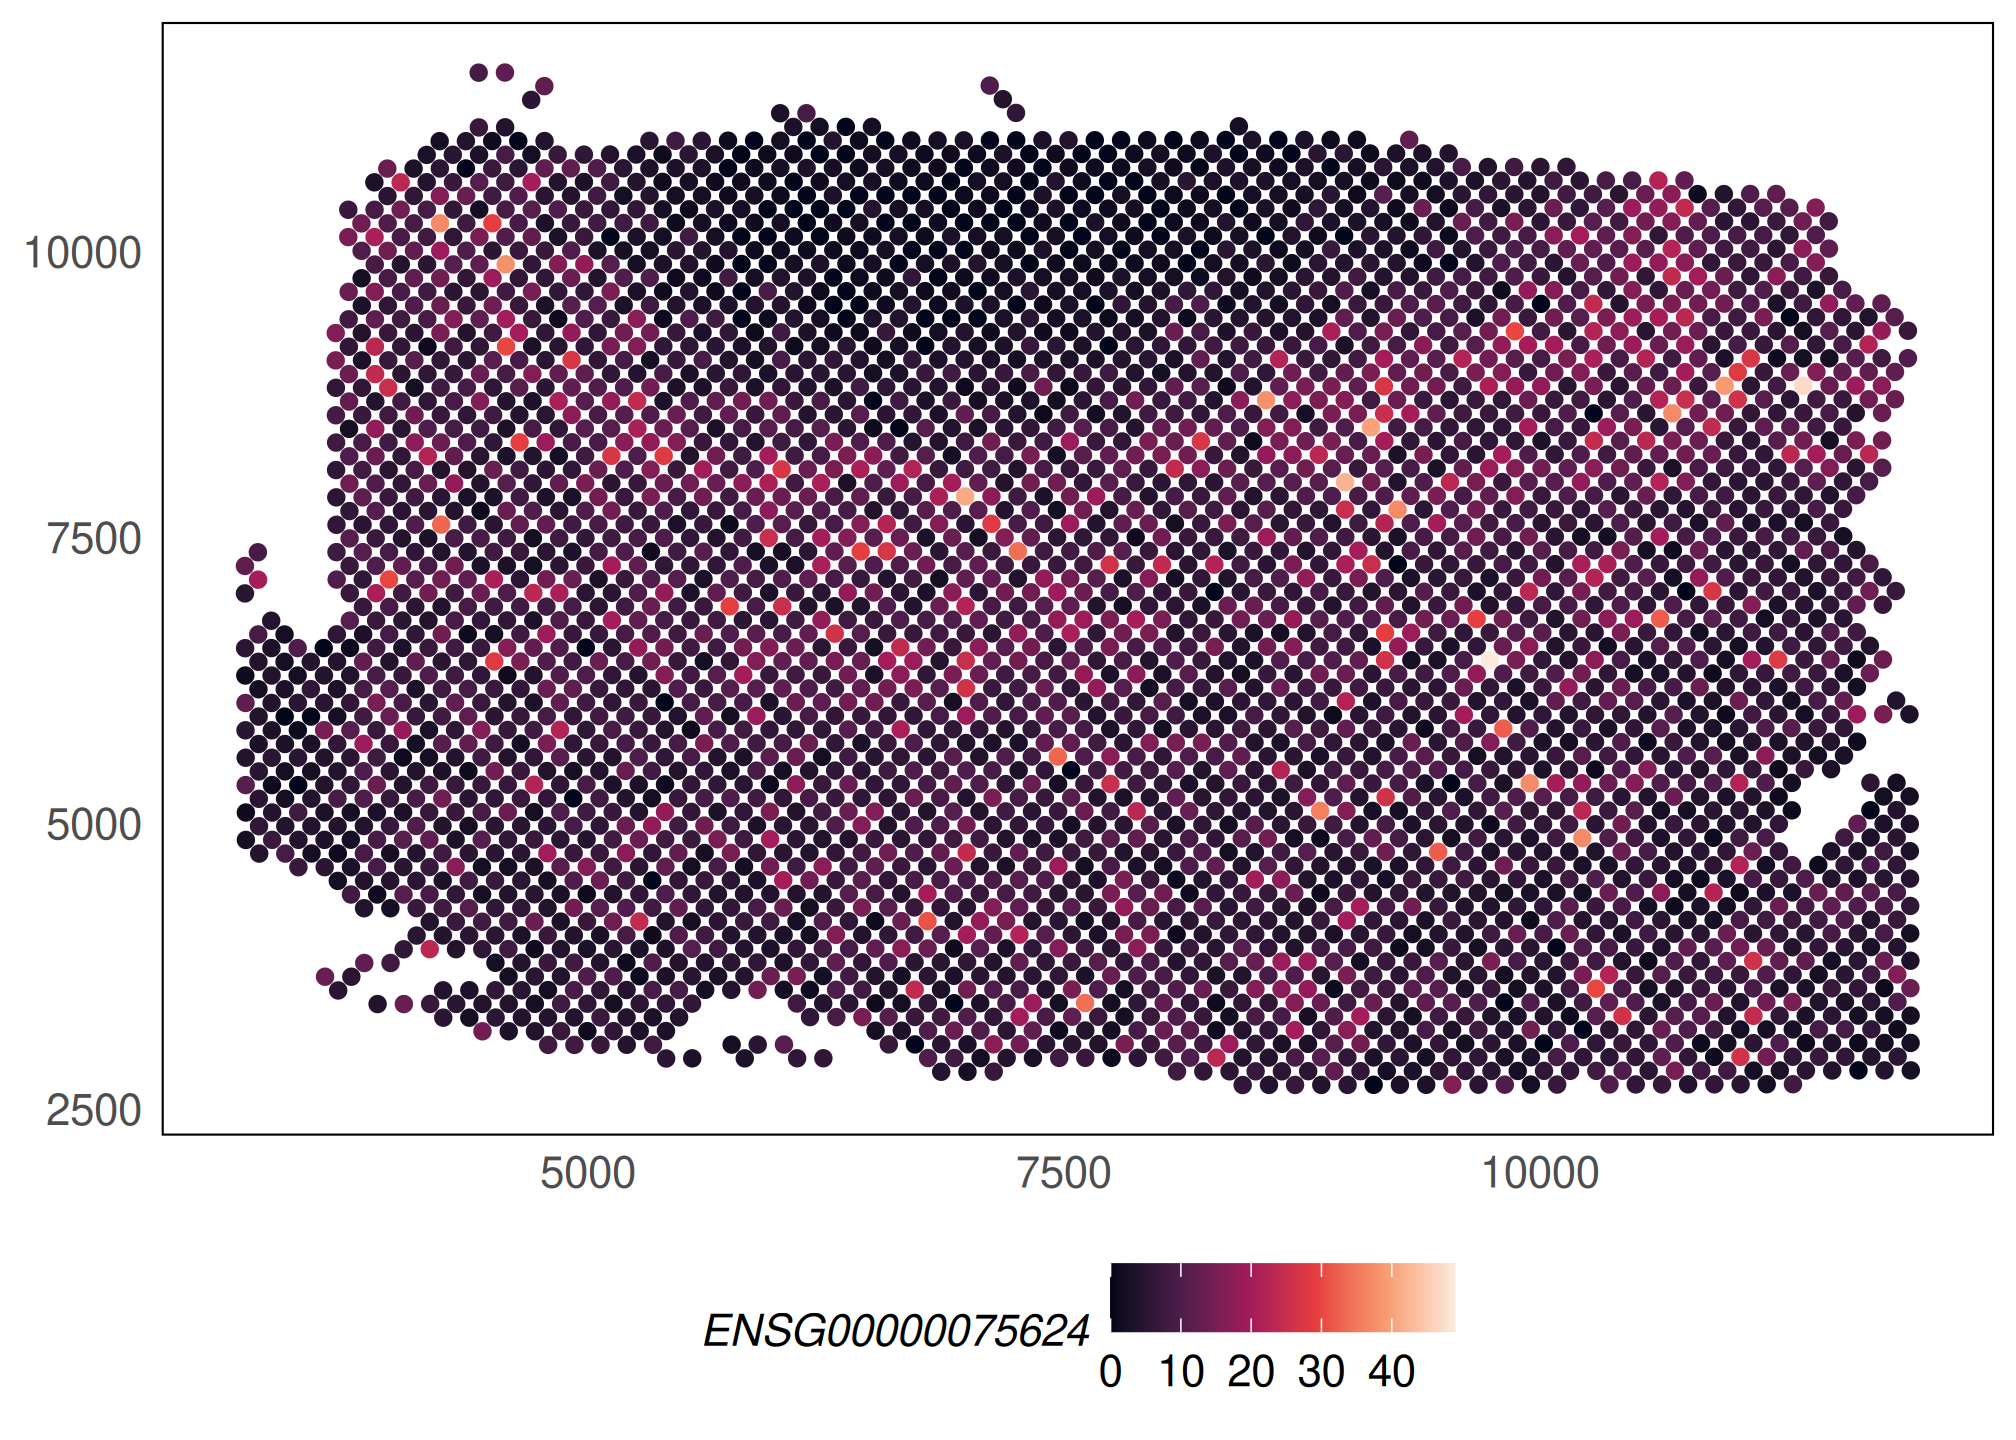
# plot spatial expression
plotSpatial(HumanDLPFC, what = "expression", colour = ENSG00000075624) +
 scale_colour_viridis_c(option = "F")
# plot logcounts
logcounts(HumanDLPFC) <- log2(counts(HumanDLPFC) + 1)
plotSpatial(HumanDLPFC, what = "expression", colour = ENSG00000075624, assay = "logcounts") +
 scale_colour_viridis_c(option = "F")
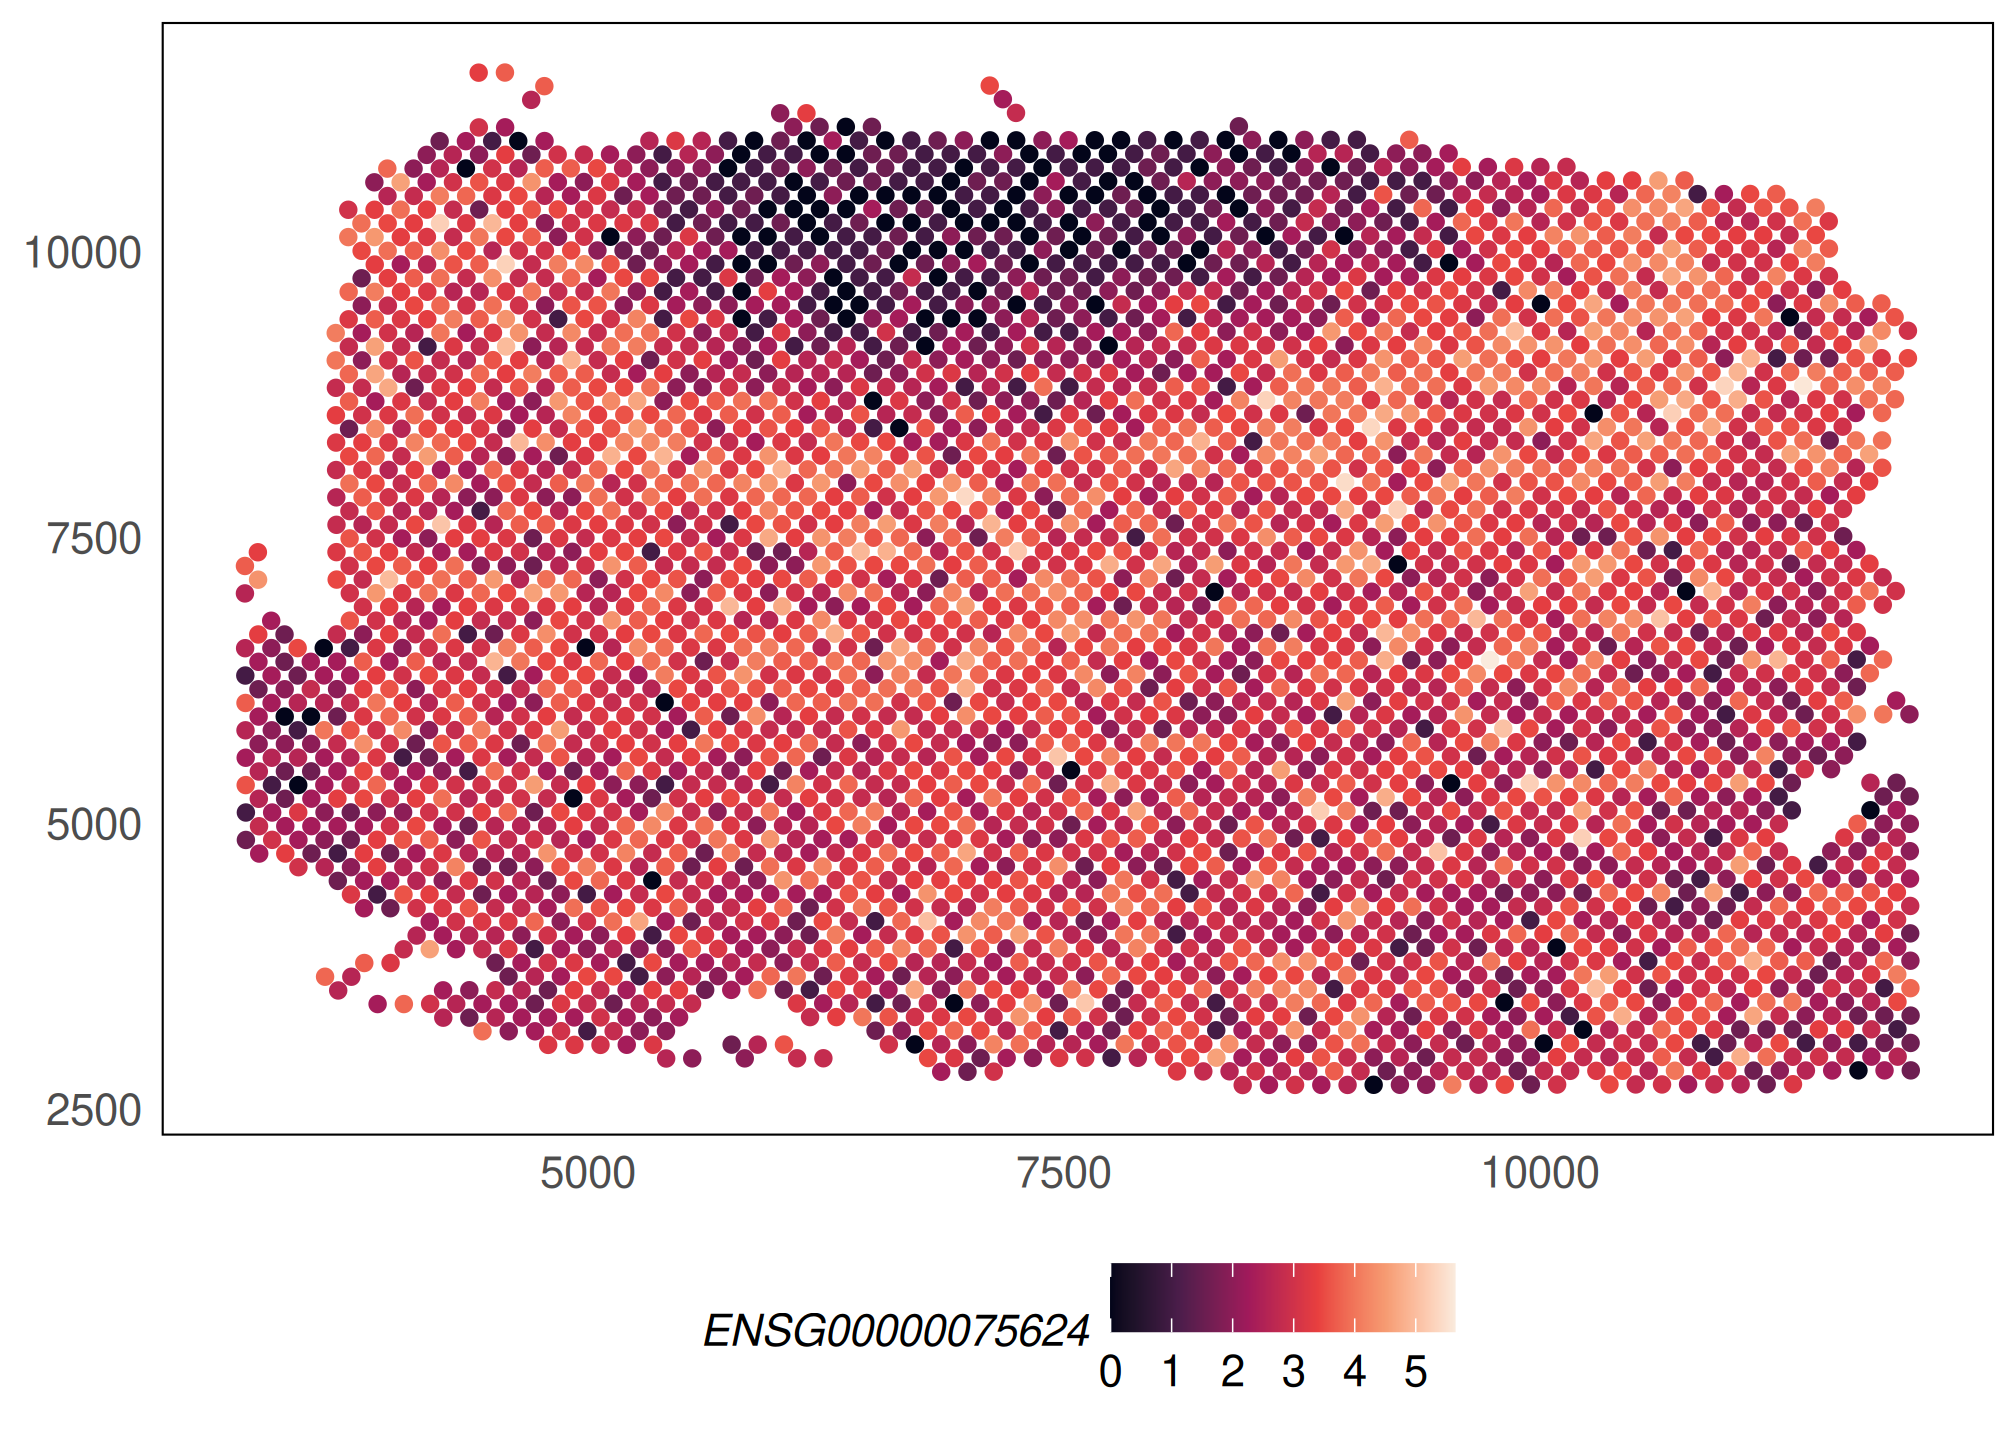
# change point shape
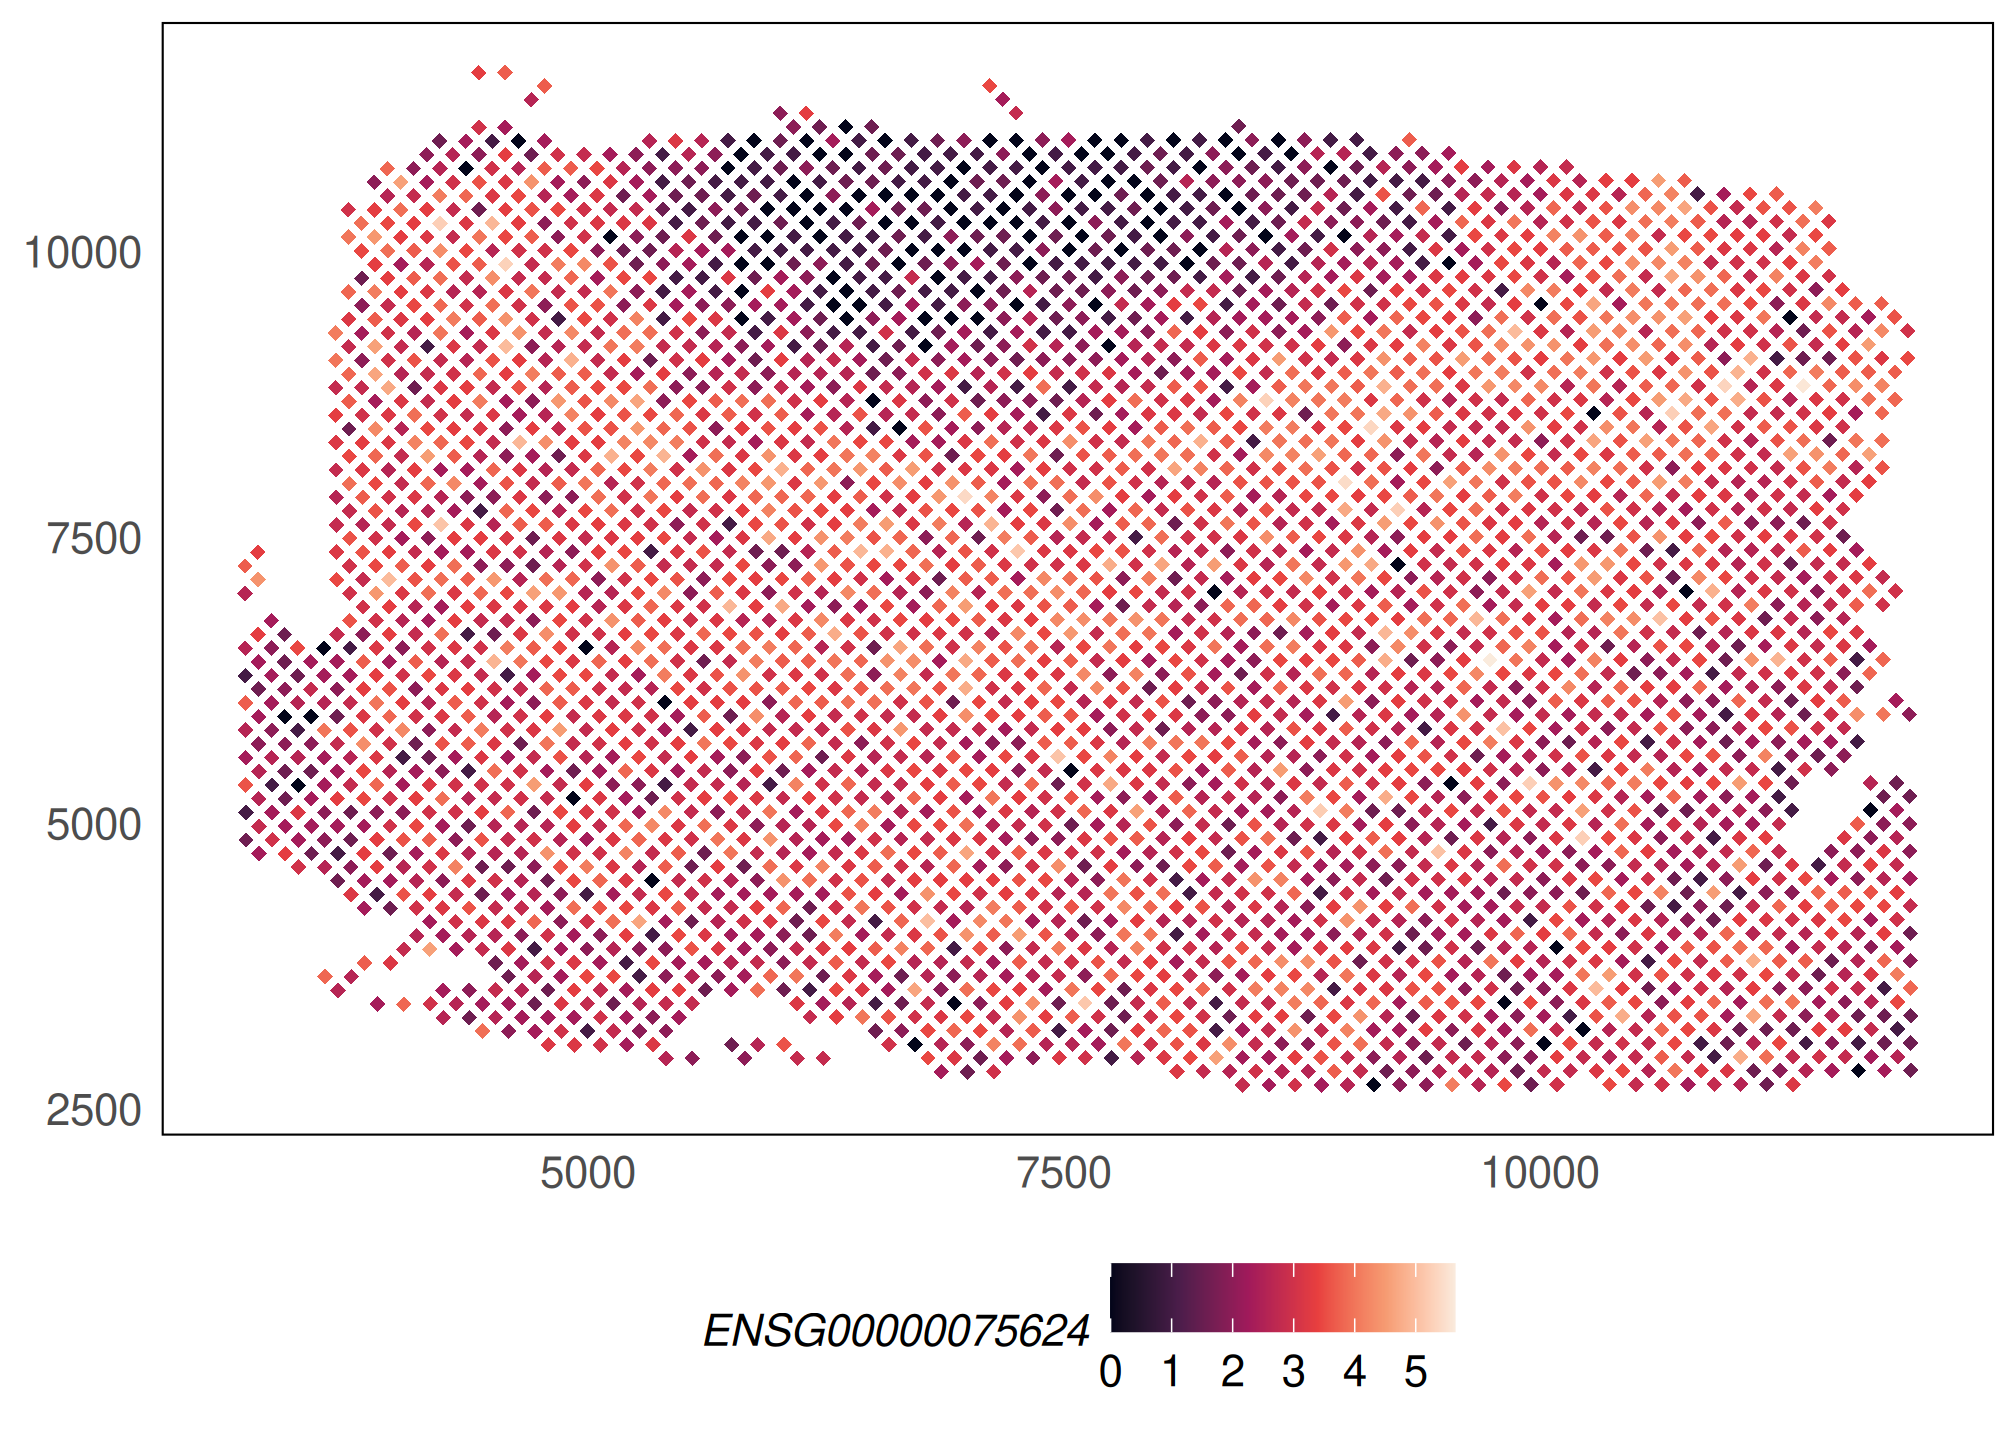
plotSpatial(HumanDLPFC, what = "expression", colour = ENSG00000075624,
  assay = "logcounts", shape = 18) +
 scale_colour_viridis_c(option = "F")