plotCovariate

Diagnostic plot of predicted expression for a covariate

Description

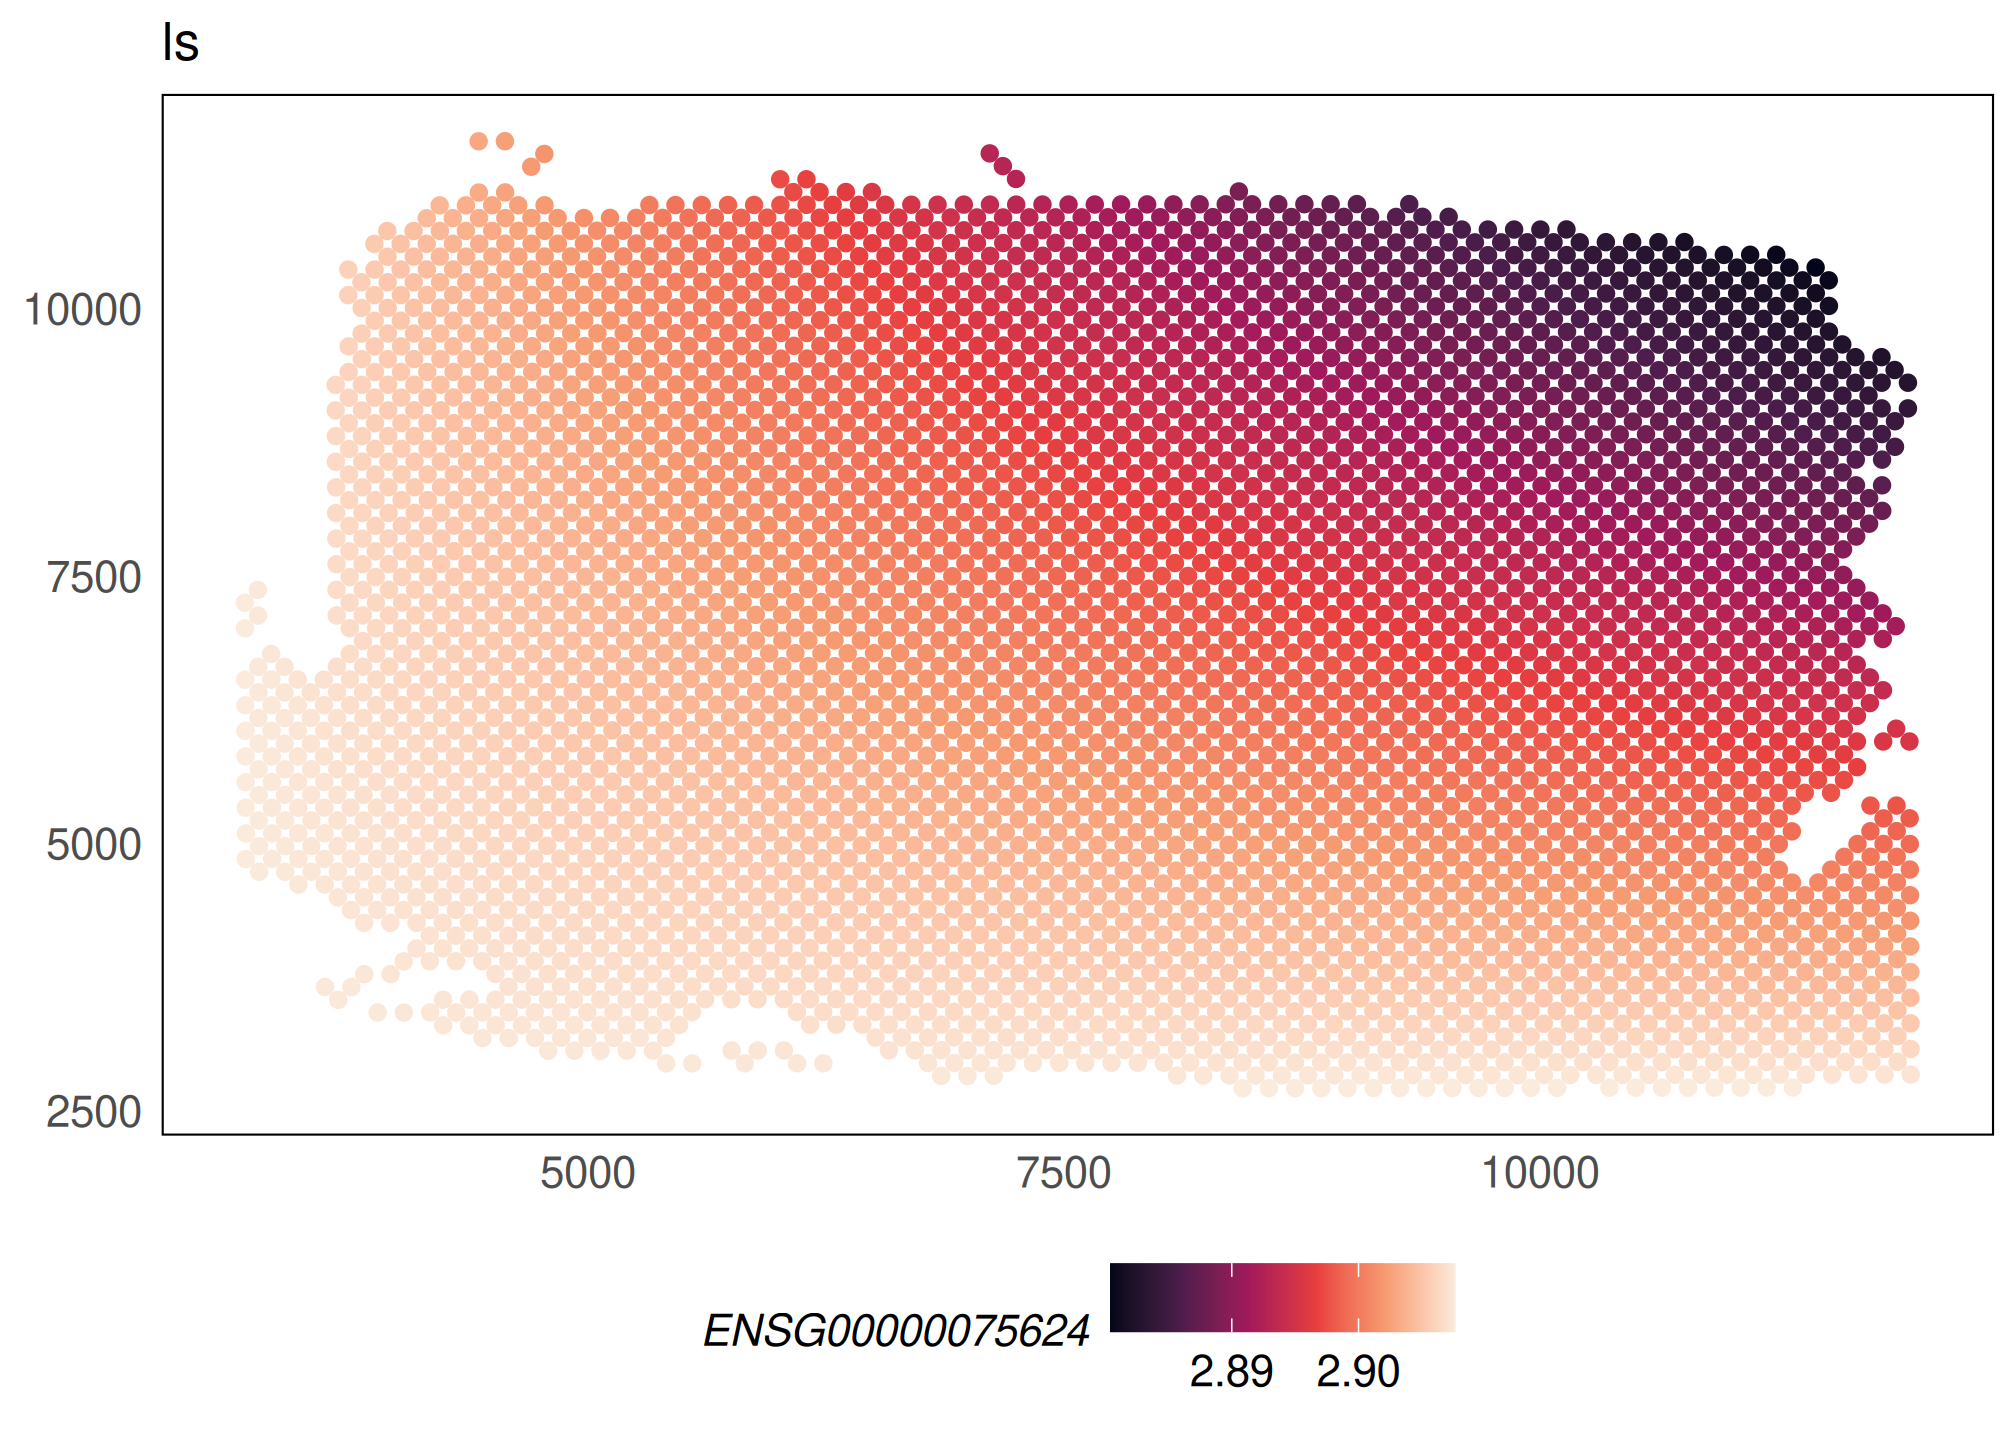
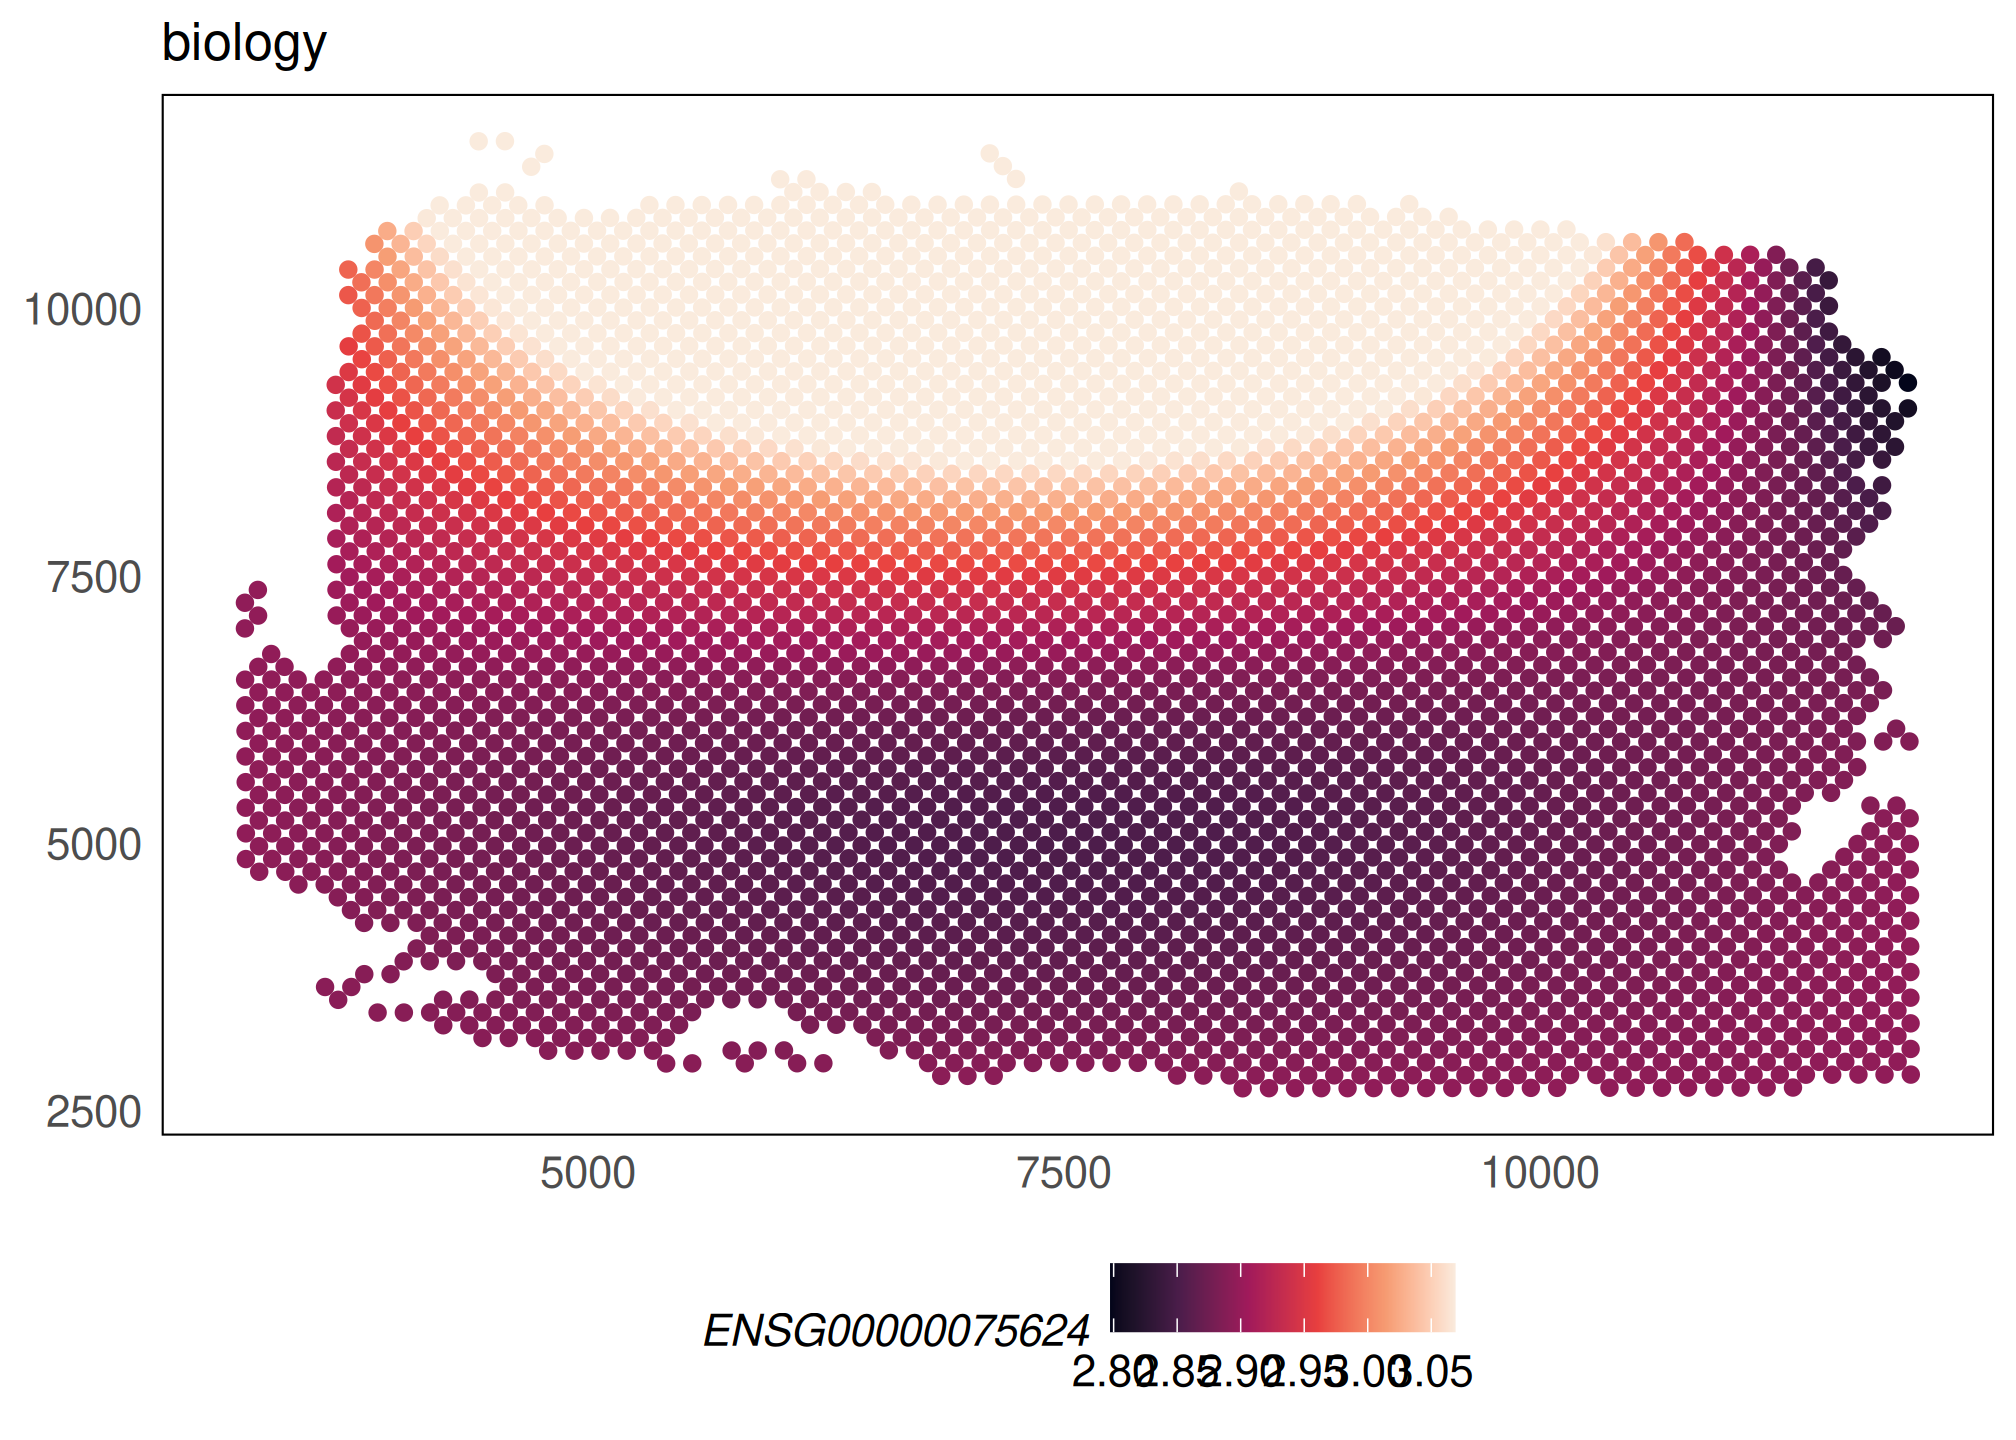
This function can be used to spatially visualise the library size, biology or batch specific effect modelled for each gene.

Usage

plotCovariate(spe, covariate = c("biology", "ls", "batch"), ...)

Arguments

spe a SpatialExperiment object.
covariate a character, specifying the type of covariate to be plot: "biology" (default), "ls" to plot the library size effect, and "batch" to plot the batch-specific effect.
… additional parameters to be passed to the plotSpatial function.

Value

a ggplot2 object

Examples

Note

The code below runs when the site is built, on a small pre-fitted subset of HumanDLPFC (301 genes x 4015 spots; SpaNorm(sample.p = 0.05, df.tps = 2), SpaNormSVG() and SpaNormPCA() already applied) that is fitted once per build. The outputs are those of the code shown.

library("SpaNorm")

library(SpatialExperiment)
library(ggplot2)

data(HumanDLPFC)

HumanDLPFC = SpaNorm(HumanDLPFC, sample.p = 0.05, df.tps = 2, tol = 1e-2)
(1/2) Retrieve precomputed SpaNorm model
(2/2) Normalising data
# plot spatial region annotations
p1 <- plotCovariate(HumanDLPFC, covariate = "biology", colour = ENSG00000075624) +
  scale_colour_viridis_c(option = "F")
p1
p2 <- plotCovariate(HumanDLPFC, covariate = "ls", colour = ENSG00000075624) +
  scale_colour_viridis_c(option = "F")
p2