import spanormpy as sn
# adata: the HumanDLPFC AnnData (raw counts in X, coordinates in obsm["spatial"])
# colour spots by an annotation
ax = sn.pl.plot_spatial(adata, color="AnnotatedCluster", size=3)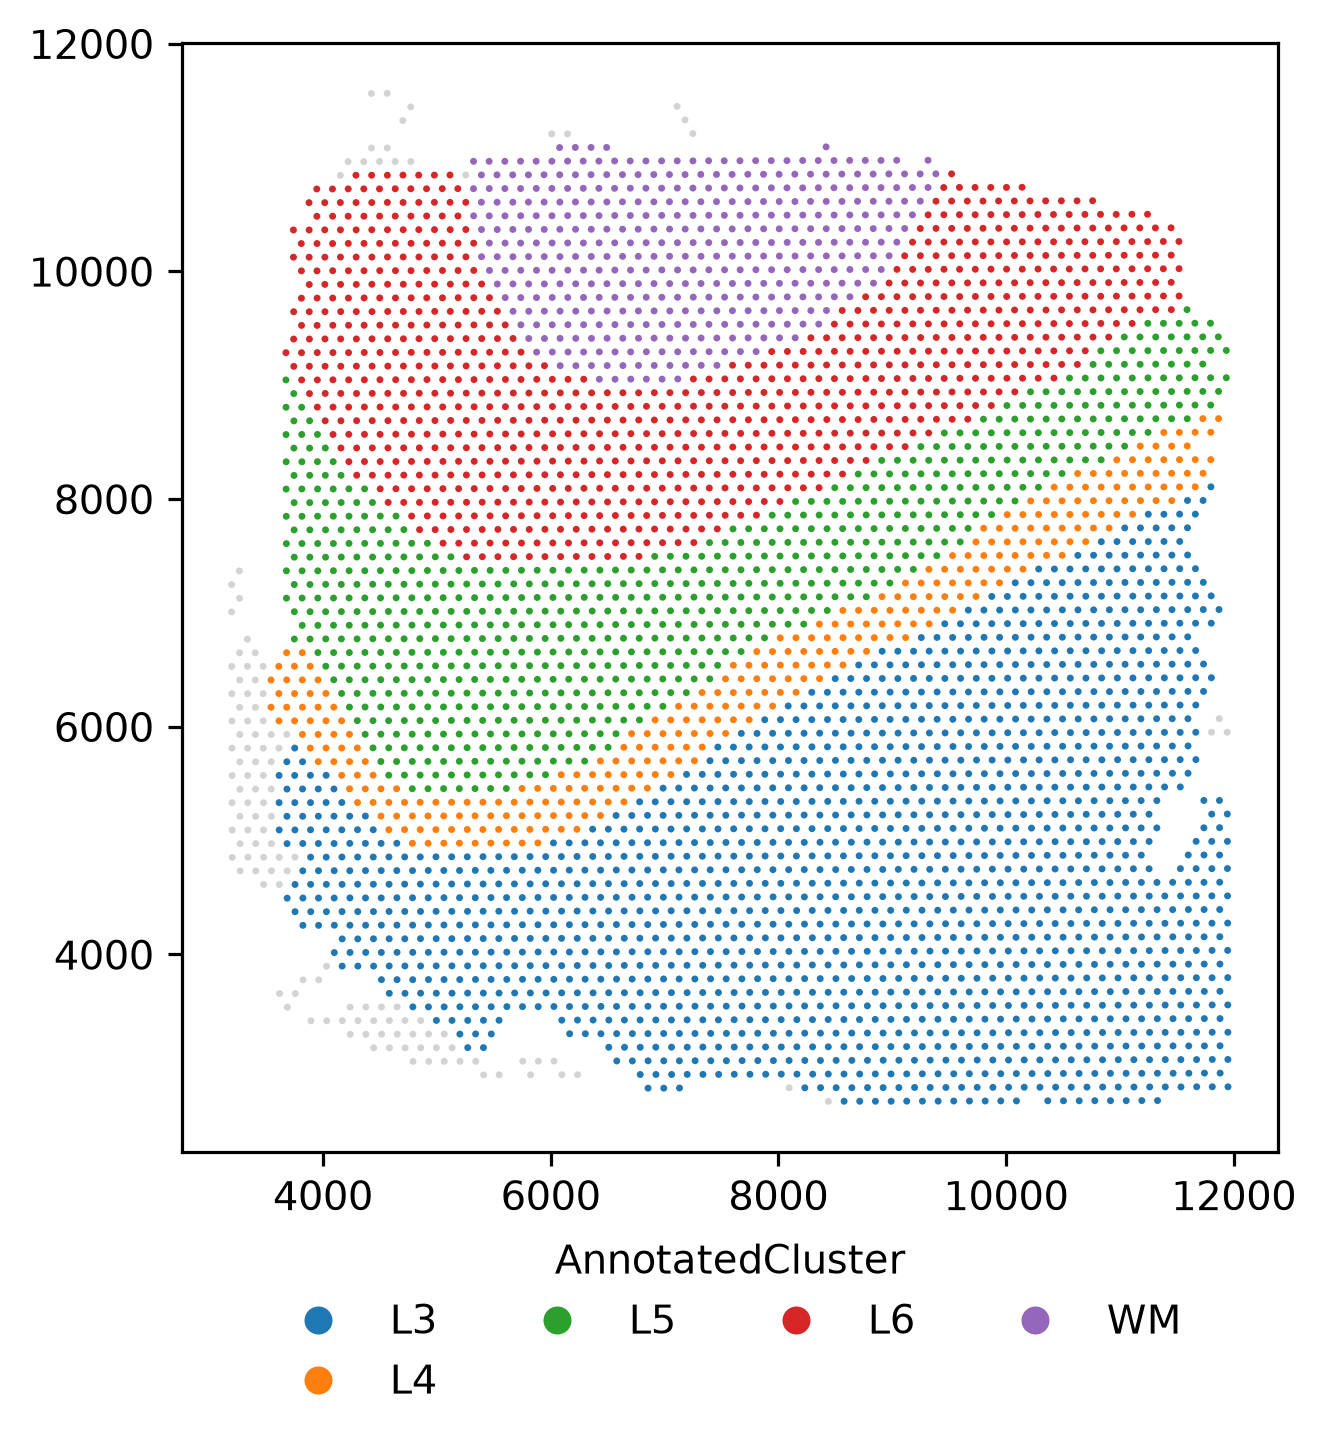
pl.plot_spatial(
    adata,
    what='annotation',
    color=None,
    layer=None,
    basis=None,
    img=False,
    crop=False,
    img_alpha=1.0,
    size=None,
    circles=False,
    ax=None,
    show=None,
    library_id=None,
    img_key='hires',
    spatial_key='spatial',
    **kwargs,
)
Plot spots at their spatial coordinates (R plotSpatial).
| Name | Type | Description | Default |
|---|---|---|---|
| adata | Annotated data matrix with obsm[spatial_key]. |
required | |
| what | "annotation" (color is an obs column), "expression" (color is a gene, read from layer or X) or "reduceddim" (color is a column name or index of obsm[basis]). |
'annotation' |
|
| color | What to colour spots by; None draws plain spots. |
None |
|
| layer | Expression layer (default X) and the obsm key ("X_" prefix optional). |
None |
|
| basis | Expression layer (default X) and the obsm key ("X_" prefix optional). |
None |
|
| img | Draw the tissue image from uns["spatial"][library_id]["images"][img_key] (scanpy Visium layout); coordinates are scaled by tissue_<img_key>_scalef. An error is raised when no image is present. |
False |
|
| crop | Limit the axes to the extent of the spots (padded by the spot radius). Requires img=True and is ignored otherwise, as in R. |
False |
|
| img_alpha | Image opacity in [0, 1]. | 1.0 |
|
| size | Marker area (points^2), or the circle radius in full-resolution pixels when circles=True (default 100, as in R; the radius is multiplied by the image scale factor). |
None |
|
| circles | Draw spots as true circles in data units (slower for large data). | False |
|
| ax | Axes to draw on; a new figure is created when None. |
None |
|
| show | Call plt.show() when true (None is the same as False). The axes are always returned. |
None |
|
| library_id | Entry of uns["spatial"] (default: the first), image resolution ("hires"/"lowres") and obsm key of the coordinates. |
None |
|
| img_key | Entry of uns["spatial"] (default: the first), image resolution ("hires"/"lowres") and obsm key of the coordinates. |
None |
|
| spatial_key | Entry of uns["spatial"] (default: the first), image resolution ("hires"/"lowres") and obsm key of the coordinates. |
None |
|
| **kwargs | Passed to the scatter (or PatchCollection when circles=True). |
{} |
The code below runs when the site is built, on a small pre-fitted subset of HumanDLPFC (301 genes x 4015 spots; spanorm(sample_p=0.05, df_tps=2), spanorm_svg() and spanorm_pca() already applied) that is fitted once per build and loaded as adata. The outputs are those of the code shown.
import spanormpy as sn
# adata: the HumanDLPFC AnnData (raw counts in X, coordinates in obsm["spatial"])
# colour spots by an annotation
ax = sn.pl.plot_spatial(adata, color="AnnotatedCluster", size=3)
# colour spots by the expression of a gene
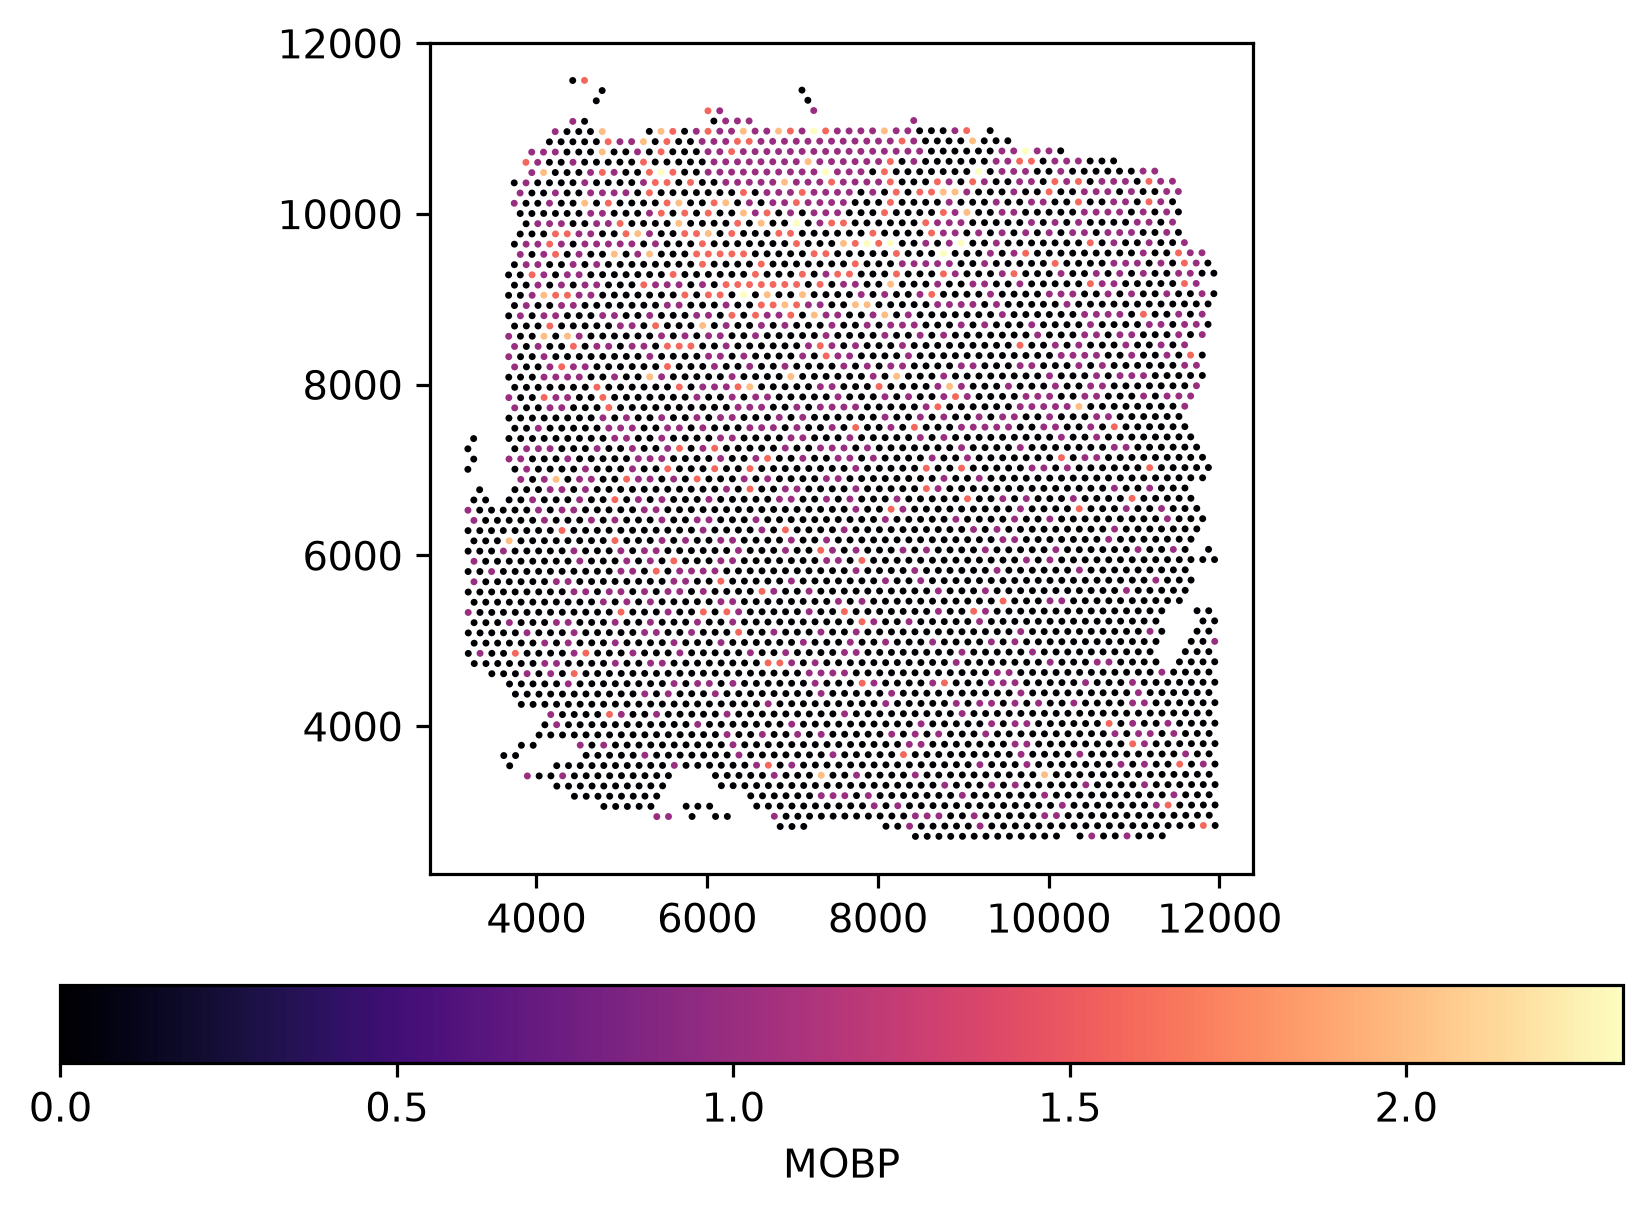
ax = sn.pl.plot_spatial(adata, what="expression", color="MOBP", size=3)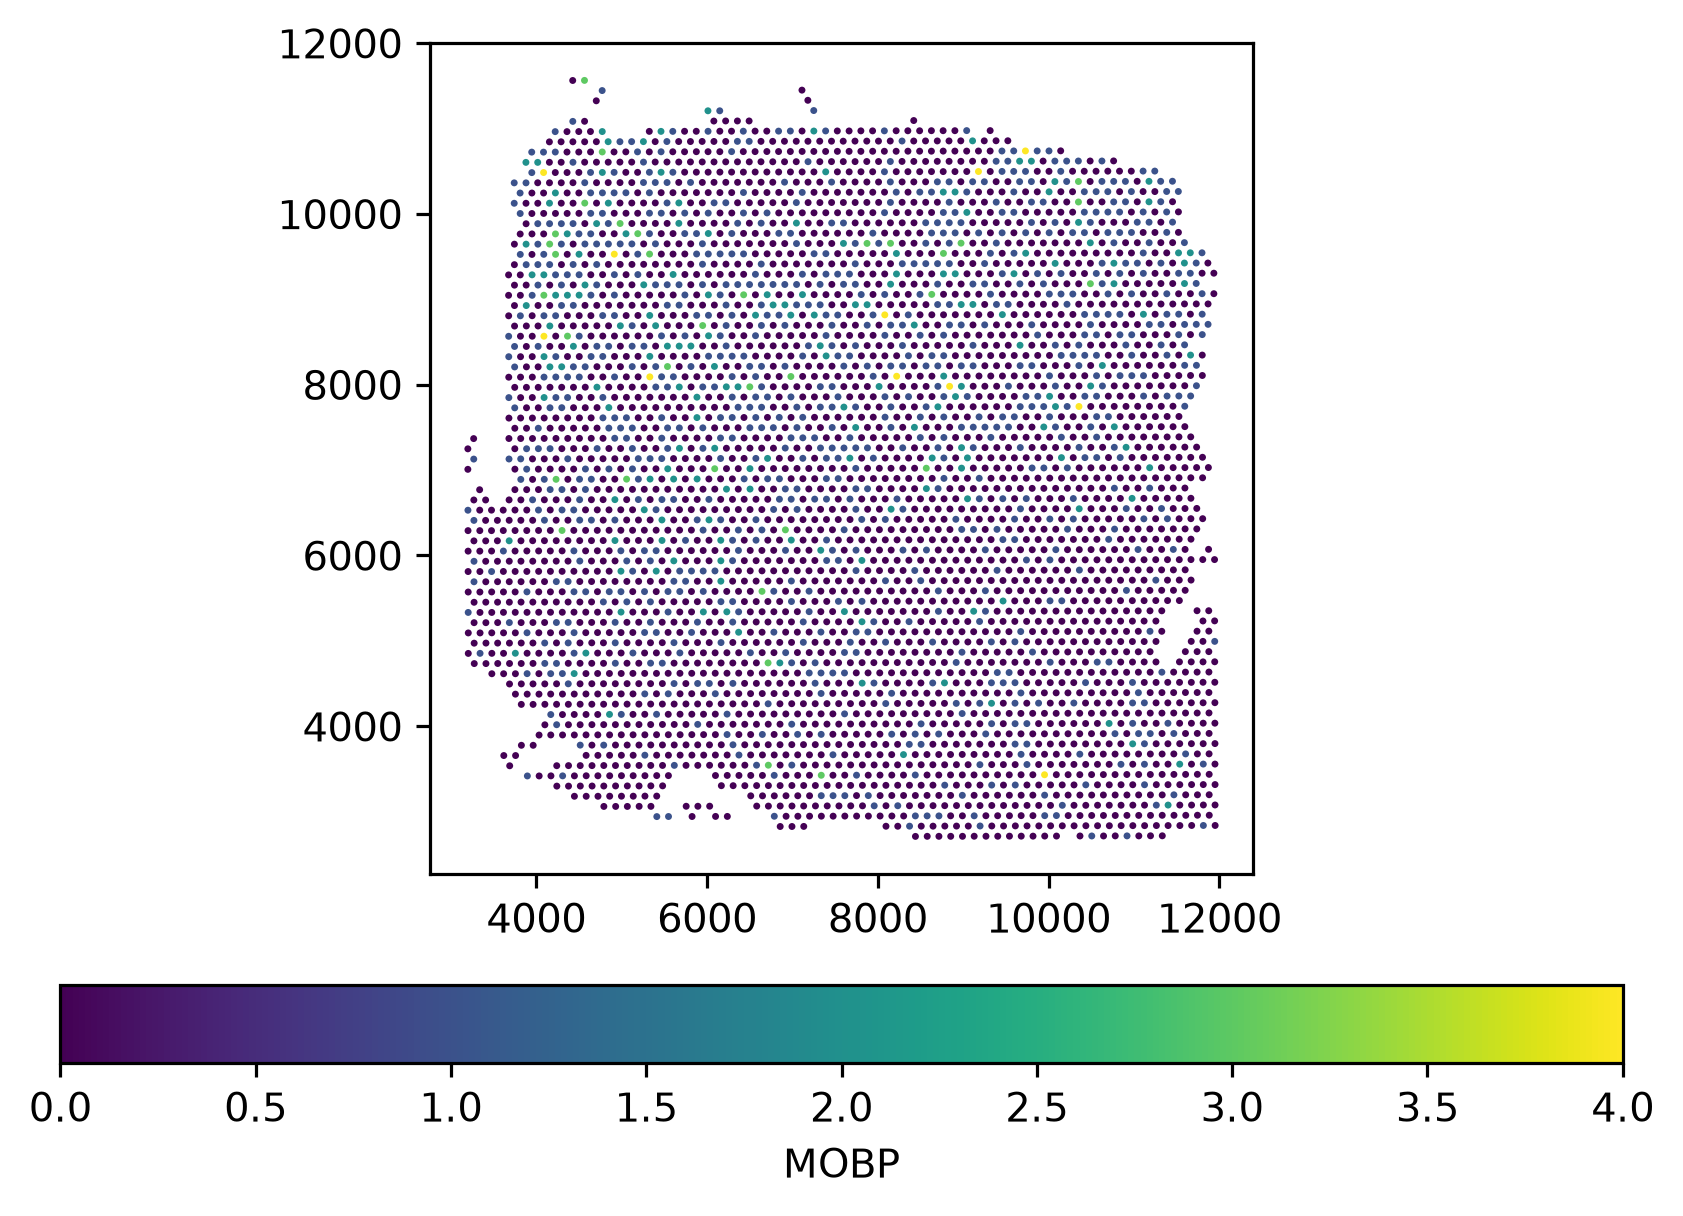
# use a layer (here the normalised values written by sn.spanorm) and a different colour map
ax = sn.pl.plot_spatial(adata, what="expression", color="MOBP", layer="logcounts",
                        size=3, cmap="magma")