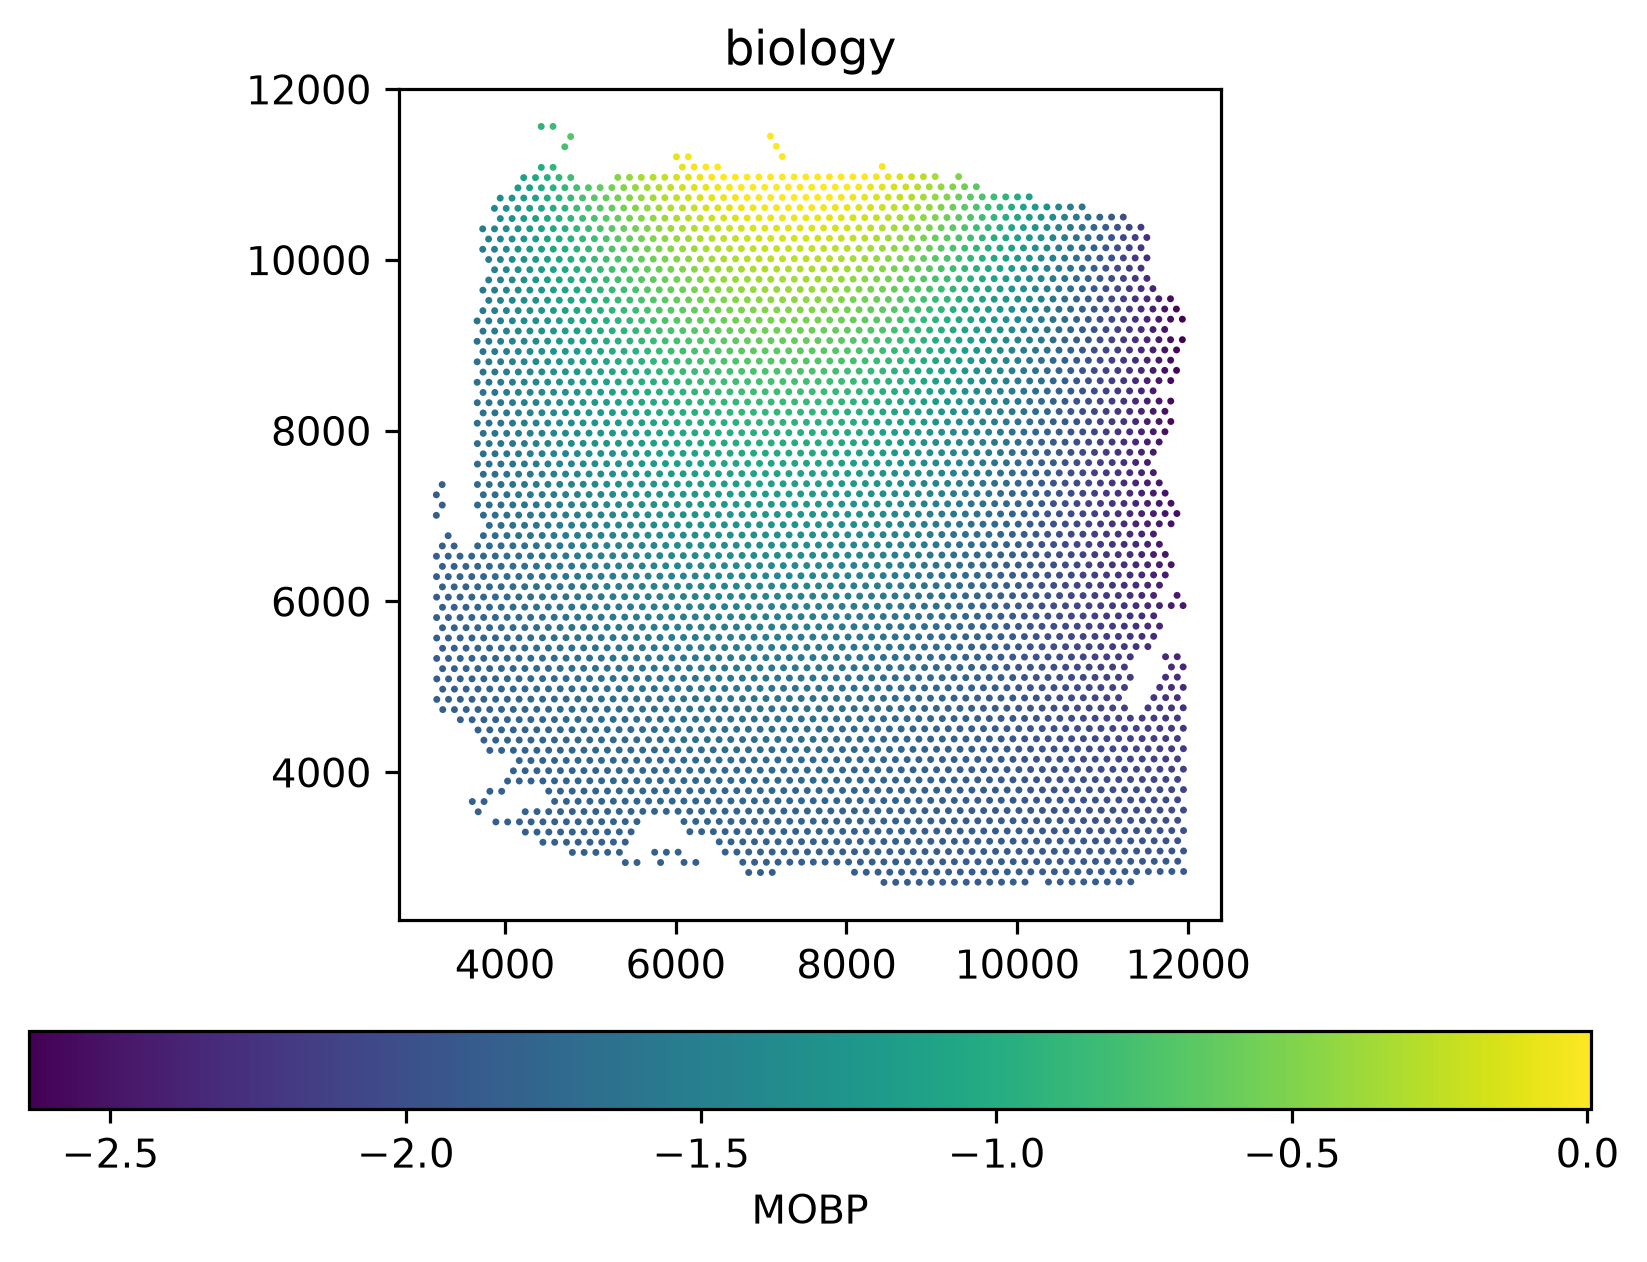
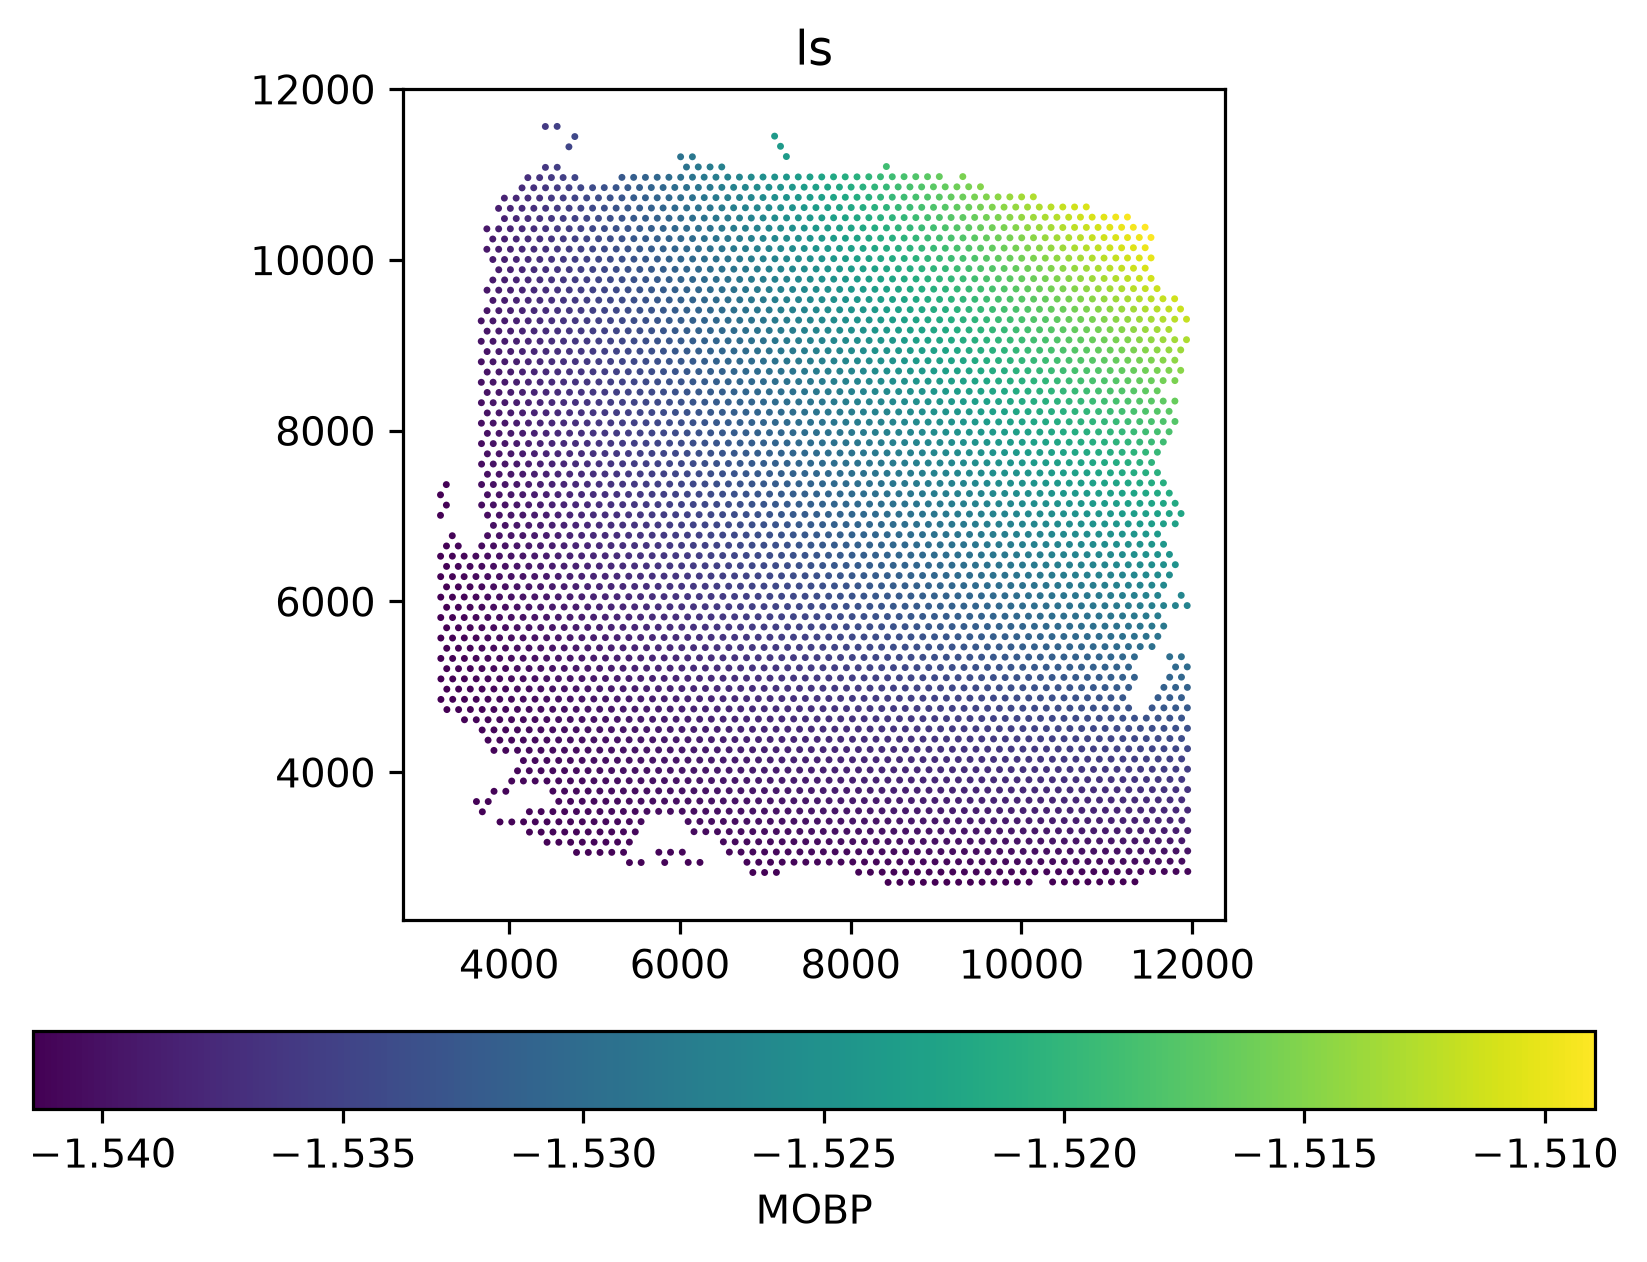
Spatially plot the library-size, biology or batch effect modelled for a gene (R plotCovariate).
Parameters
Name
Type
Description
Default
adata
Object holding a SpaNorm fit (see :func:spanormpy.spanorm).
required
covariate
"biology" (default), "ls" or "batch".
'biology'
color
The gene (in adata.var_names) to plot; required, as in R.
None
name
Name of the stored fit.
'spanorm'
**kwargs
Passed to :func:spanormpy.pl.plot_spatial (img, crop, ax, show, …).
{}
Examples
Note
The code below runs when the site is built, on a small pre-fitted subset of HumanDLPFC (301 genes x 4015 spots; spanorm(sample_p=0.05, df_tps=2), spanorm_svg() and spanorm_pca() already applied) that is fitted once per build and loaded as adata. The outputs are those of the code shown.
import spanormpy as sn# adata: the HumanDLPFC AnnData (raw counts in X, coordinates in obsm["spatial"]),# already fitted with sn.spanorm(adata, sample_p=0.05, df_tps=2)# the biology (spatially varying) component learnt for MOBPax = sn.pl.plot_covariate(adata, covariate="biology", color="MOBP", size=3)
# the library size effect learnt for MOBPax = sn.pl.plot_covariate(adata, covariate="ls", color="MOBP", size=3)